

【mBDSR (Moving Average Filter) Buy Signal on Pullback】Focus on noticeable highs (Bitcoin) (4)
【Mastering RCI!! Trend Reversal, Buy Dips, Sell on Rallies】
Iconic Indicator Pairing with RCI: 【BODSOR・mBDSR】
Methods and Case Studies (PDF) ★GogoJungle AWARD2020 Winner★
https://www.gogojungle.co.jp/tools/indicators/11836
mBDSR (RCI Filter)andmBDSR (Moving Average Filter)have different roles. The PDF above also touches on how to use them appropriately.
Below,mBDSR (Moving Average Filter)signs will be introduced with examples.
Bitcoin / USD BTCUSD 15-minute chart
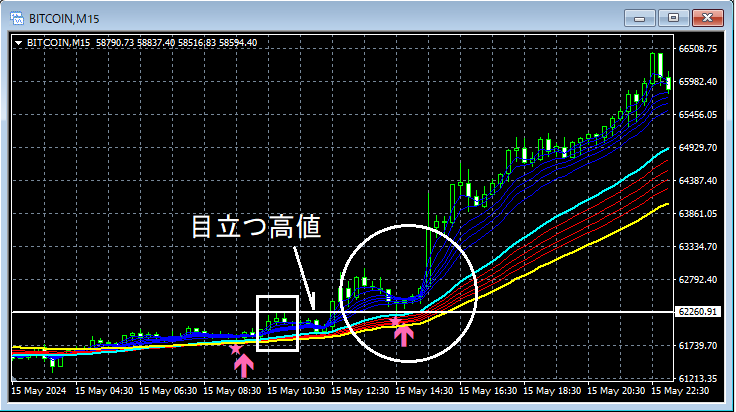
Looking around the area circled in white on the 15-minute chart above,a noticeable highhas dropped toward the vicinity ofmBDSR (Moving Average Filter) dip-buy signallighting up, and subsequently, the price has risen firmly.
From this example,a trading method that focuses on noticeable highsandthe signals of mBDSRshowing high compatibility.
※Please note that some charts mentioned in this article may have had circles, lines, or squares added for explanatory convenience.
Iconic Indicator Pairing with RCI: 【BODSOR・mBDSR】
Methods and Case Studies (PDF) ★GogoJungle AWARD2020 Winner★
https://www.gogojungle.co.jp/tools/indicators/11836
The PDF file includes 358 items (over 1,400 pages, over 470,000 characters in total).
Most of them are compiled as examples that break down how to logically link higher and lower timeframes using three RCI lines, progressively considering the conditions across multiple lower timeframes, and ultimately waiting for dip-buy or rally-sell timings (i.e., mBDSR signals) on the lower timeframes.
Additionally,many focus on identifying points where multiple entry reasons overlap.There are also many
cases wherethe method using three RCI lines to explore upside and downside targetsis included.
In the PDF explanations,more than 1,350 chartsare used.

Iconic Indicator Pairing with RCI: 【BODSOR・mBDSR】
Methods and Case Studies (PDF) ★GogoJungle AWARD2020 Winner★
https://www.gogojungle.co.jp/tools/indicators/11836
mBDSR (RCI Filter)andmBDSR (Moving Average Filter)have different roles. The PDF above also touches on how to use them appropriately.
Below,mBDSR (Moving Average Filter)signs will be introduced with examples.
Bitcoin / USD BTCUSD 15-minute chart
Looking around the area circled in white on the 15-minute chart above,a noticeable highhas dropped toward the vicinity ofmBDSR (Moving Average Filter) dip-buy signallighting up, and subsequently, the price has risen firmly.
From this example,a trading method that focuses on noticeable highsandthe signals of mBDSRshowing high compatibility.
※Please note that some charts mentioned in this article may have had circles, lines, or squares added for explanatory convenience.
Iconic Indicator Pairing with RCI: 【BODSOR・mBDSR】
Methods and Case Studies (PDF) ★GogoJungle AWARD2020 Winner★
https://www.gogojungle.co.jp/tools/indicators/11836
The PDF file includes 358 items (over 1,400 pages, over 470,000 characters in total).
Most of them are compiled as examples that break down how to logically link higher and lower timeframes using three RCI lines, progressively considering the conditions across multiple lower timeframes, and ultimately waiting for dip-buy or rally-sell timings (i.e., mBDSR signals) on the lower timeframes.
Additionally,many focus on identifying points where multiple entry reasons overlap.There are also many
cases wherethe method using three RCI lines to explore upside and downside targetsis included.
In the PDF explanations,more than 1,350 chartsare used.
× ![]()


