

【mBDSR (Moving Average Filter Buy Signal)】Focus on noticeable highs (Bitcoin) (3)
【Mastering RCI!! Trend Reversal, Buy on Dips, Sell on Rallies】
Indicator【BODSOR・mBDSR】that shines in combination with RCI
Methods and Case Studies (PDF) ★GogoJungle AWARD2020 Winner★
https://www.gogojungle.co.jp/tools/indicators/11836
mBDSR (RCI filter)andmBDSR (Moving Average Filter)have different roles. The above PDF also touches on how to use them.
Below,mBDSR (Moving Average Filter)signs will be illustrated.
Bitcoin / USD BTCUSD 15-minute chart
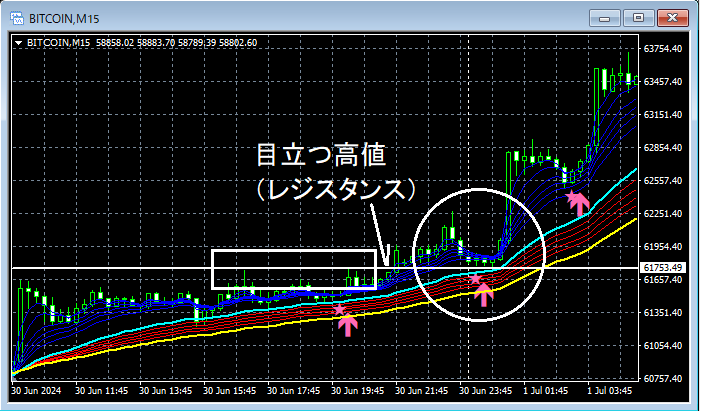
Looking at the area circled in white on the 15-minute chart above,noticeable high (resistance line)is approached after a declinemBDSR (Moving Average Filter) Buy-the-dip signallights up, and subsequently, the price rises firmly.
From this example,a trading method that focuses on noticeable highs (resistance lines) and resistance-turned-support (role reversal)andthe signals of mBDSRshow strong compatibility.
※Please note that for convenience of explanation, some charts in this article may include added circles, straight lines, or squares.
Indicator【BODSOR・mBDSR】that shines in combination with RCI
Methods and Case Studies (PDF) ★GogoJungle AWARD2020 Winner★
https://www.gogojungle.co.jp/tools/indicators/11836
The PDF file includes 358 items (over 1,400 pages, over 470,000 characters in total).
Many of them are examples that link multiple higher-timeframe and lower-timeframe logically using three RCI lines, ultimately waiting for dips or pullbacks timing on the lower timeframes (i.e., the mBDSR signals).Additionally,
.
Also included is a method for exploring upward and downward targets using the three RCI lines.
In the PDF, explanations use.

Indicator【BODSOR・mBDSR】that shines in combination with RCI
Methods and Case Studies (PDF) ★GogoJungle AWARD2020 Winner★
https://www.gogojungle.co.jp/tools/indicators/11836
mBDSR (RCI filter)andmBDSR (Moving Average Filter)have different roles. The above PDF also touches on how to use them.
Below,mBDSR (Moving Average Filter)signs will be illustrated.
Bitcoin / USD BTCUSD 15-minute chart
Looking at the area circled in white on the 15-minute chart above,noticeable high (resistance line)is approached after a declinemBDSR (Moving Average Filter) Buy-the-dip signallights up, and subsequently, the price rises firmly.
From this example,a trading method that focuses on noticeable highs (resistance lines) and resistance-turned-support (role reversal)andthe signals of mBDSRshow strong compatibility.
※Please note that for convenience of explanation, some charts in this article may include added circles, straight lines, or squares.
Indicator【BODSOR・mBDSR】that shines in combination with RCI
Methods and Case Studies (PDF) ★GogoJungle AWARD2020 Winner★
https://www.gogojungle.co.jp/tools/indicators/11836
The PDF file includes 358 items (over 1,400 pages, over 470,000 characters in total).
Many of them are examples that link multiple higher-timeframe and lower-timeframe logically using three RCI lines, ultimately waiting for dips or pullbacks timing on the lower timeframes (i.e., the mBDSR signals).Additionally,
.
Also included is a method for exploring upward and downward targets using the three RCI lines.
In the PDF, explanations use.
× ![]()


