

【mBDSR (Moving Average Filter) Buy Signal】Focus on the noticeable high price (Bitcoin) (2)
【Mastering RCI!! Trend Reversal, Buy the Dip, Sell the Rally】
Indicator that shines in combination with RCI: 【BODSOR・mBDSR】
and methods & case studies (PDF) ★GogoJungle AWARD2020 winner★
https://www.gogojungle.co.jp/tools/indicators/11836
mBDSR (RCI filter)andmBDSR (Moving Average filter)have different roles. The above PDF also discusses how to use these appropriately.
Below,mBDSR (Moving Average filter)signs will be introduced as examples.
Bitcoin / USD BTCUSD 15-minute chart
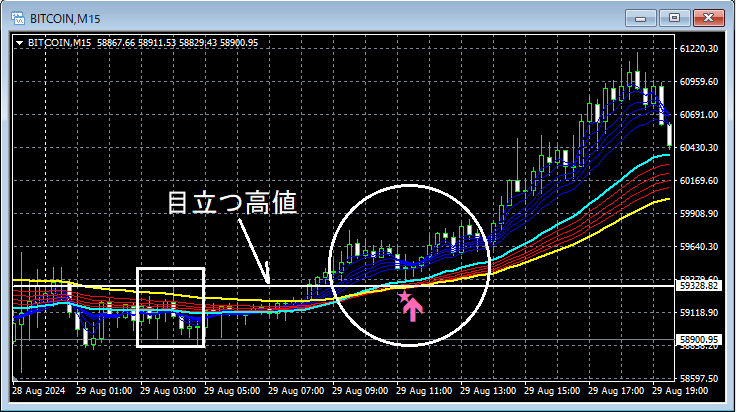
In the 15-minute chart above,the line indicating past notable highshas approached,the dip-buy signal of mBDSR (Moving Average filter)lights up, and subsequently price rises firmly.
From this example,the compatibility between a trade method focusing on past notable highsandthe mBDSR signalis evident.
*Please note that in the charts shown in this article, for convenience of explanation, circles, lines, and rectangles may be added.
Indicator that shines in combination with RCI: 【BODSOR・mBDSR】
and methods & case studies (PDF) ★GogoJungle AWARD2020 winner★
https://www.gogojungle.co.jp/tools/indicators/11836
The PDF file includes 358 files (over 1,400 pages, over 470,000 characters).
Many of them are a collection of examples that break down the process of logically linking higher and lower timeframes using three RCI lines, ultimately waiting for pullback buys or pullback sells on the lower timeframe (i.e., the mBDSR signal).In addition,
.
Also included is a method for exploring upside and downside targets using the three-line RCI approach.
In the PDF explanations,are used.

Indicator that shines in combination with RCI: 【BODSOR・mBDSR】
and methods & case studies (PDF) ★GogoJungle AWARD2020 winner★
https://www.gogojungle.co.jp/tools/indicators/11836
mBDSR (RCI filter)andmBDSR (Moving Average filter)have different roles. The above PDF also discusses how to use these appropriately.
Below,mBDSR (Moving Average filter)signs will be introduced as examples.
Bitcoin / USD BTCUSD 15-minute chart
In the 15-minute chart above,the line indicating past notable highshas approached,the dip-buy signal of mBDSR (Moving Average filter)lights up, and subsequently price rises firmly.
From this example,the compatibility between a trade method focusing on past notable highsandthe mBDSR signalis evident.
*Please note that in the charts shown in this article, for convenience of explanation, circles, lines, and rectangles may be added.
Indicator that shines in combination with RCI: 【BODSOR・mBDSR】
and methods & case studies (PDF) ★GogoJungle AWARD2020 winner★
https://www.gogojungle.co.jp/tools/indicators/11836
The PDF file includes 358 files (over 1,400 pages, over 470,000 characters).
Many of them are a collection of examples that break down the process of logically linking higher and lower timeframes using three RCI lines, ultimately waiting for pullback buys or pullback sells on the lower timeframe (i.e., the mBDSR signal).In addition,
.
Also included is a method for exploring upside and downside targets using the three-line RCI approach.
In the PDF explanations,are used.
× ![]()


