

【mBDSR (Moving Average Filter) Buy Signal on Dip】Focus on notable highs (Bitcoin) (1)
【Mastering RCI!! Trend Reversals, Buy the Dip, Sell the Rally】
Indicator 【BODSOR・mBDSR】 that delivers power when combined with RCI
and methods & case studies (PDF) ★GogoJungle AWARD 2020 Winner★
https://www.gogojungle.co.jp/tools/indicators/11836
mBDSR (RCI filter)andmBDSR (Moving Average filter)have different roles. The PDF above also touches on how to use them distinctly.
Below,examples of signals for the moving average filter (mBDSR)are introduced.
Bitcoin/US Dollar BTCUSD 5-minute chart
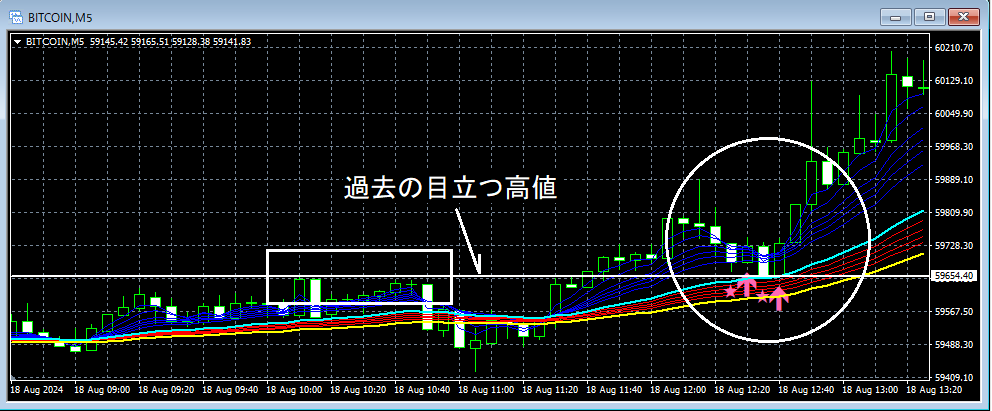
On the 5-minute chart above,near a conspicuous high (resistance line)as it retraces downward,an mBDSR (Moving Average filter) buy-the-dip signallights up, and subsequently price rises firmly.
From this example,a trading method that focuses on prominent highs (resistance) and support-turned-resistance (roll reversal)andthe signal of the mBDSRshow a high degree of compatibility.
※Please note that in the charts introduced in this article, for convenience of explanation, circles, lines, and squares may be drawn.
Indicator 【BODSOR・mBDSR】 that shines in combination with RCI
and methodologies & case studies (PDF) ★GogoJungle AWARD 2020 Winner★
https://www.gogojungle.co.jp/tools/indicators/11836
The PDF file includes 358 documents (over 1,400 pages, over 470,000 words).
Many of these are compiled as examples that methodically link higher and lower timeframes using three RCI lines to examine multiple lower-timeframe conditions, ultimately waiting for a dip-buy or pullback timing on the lower timeframe (i.e., signals of mBDSR).
Additionally,there are many that focus on capturing points where multiple entry reasons converge..
Also included is a method for exploring upside and downside potentials using the three-line RCI approach.
In the PDF explanations,more than 1,350 chartsare used.

Indicator 【BODSOR・mBDSR】 that delivers power when combined with RCI
and methods & case studies (PDF) ★GogoJungle AWARD 2020 Winner★
https://www.gogojungle.co.jp/tools/indicators/11836
mBDSR (RCI filter)andmBDSR (Moving Average filter)have different roles. The PDF above also touches on how to use them distinctly.
Below,examples of signals for the moving average filter (mBDSR)are introduced.
Bitcoin/US Dollar BTCUSD 5-minute chart
On the 5-minute chart above,near a conspicuous high (resistance line)as it retraces downward,an mBDSR (Moving Average filter) buy-the-dip signallights up, and subsequently price rises firmly.
From this example,a trading method that focuses on prominent highs (resistance) and support-turned-resistance (roll reversal)andthe signal of the mBDSRshow a high degree of compatibility.
※Please note that in the charts introduced in this article, for convenience of explanation, circles, lines, and squares may be drawn.
Indicator 【BODSOR・mBDSR】 that shines in combination with RCI
and methodologies & case studies (PDF) ★GogoJungle AWARD 2020 Winner★
https://www.gogojungle.co.jp/tools/indicators/11836
The PDF file includes 358 documents (over 1,400 pages, over 470,000 words).
Many of these are compiled as examples that methodically link higher and lower timeframes using three RCI lines to examine multiple lower-timeframe conditions, ultimately waiting for a dip-buy or pullback timing on the lower timeframe (i.e., signals of mBDSR).
Additionally,there are many that focus on capturing points where multiple entry reasons converge..
Also included is a method for exploring upside and downside potentials using the three-line RCI approach.
In the PDF explanations,more than 1,350 chartsare used.
× ![]()


