

【mBDSR (Moving Average Filter) Reversion Sell Signal】Focus on noticeable lows (Gold XAUUSD)
【Mastering RCI!! Trend Reversal, Buying Dips, and Selling Rallies】
Indicator【BODSOR・mBDSR】that shows its power in combination with RCI
Methods・Case Studies (PDF) ★GogoJungle AWARD 2020 Winner★
https://www.gogojungle.co.jp/tools/indicators/11836
mBDSR (RCI Filter)andmBDSR (Moving Average Filter)perform different roles. The above PDF also touches on how to use them.
Below, we introduce examples of signals formBDSR (Moving Average Filter)signals.
Gold XAUUSD 5-minute chart
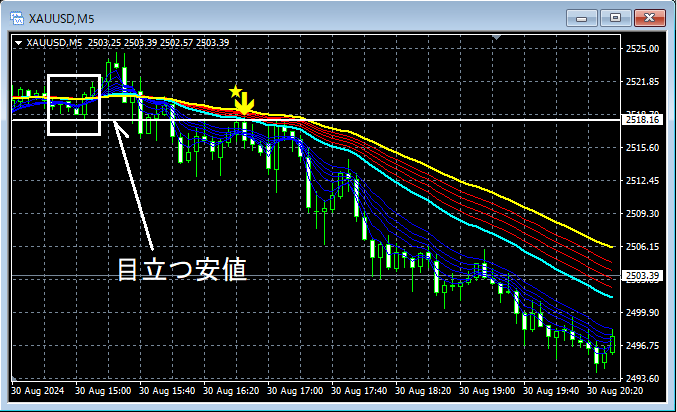
On the upper 5-minute chart,noticeable lowrises up close to a notable low,the returning-sell signal of mBDSR (Moving Average Filter)lights up, and subsequently, price decisively moves down.
From this example,it shows a high affinity between a trading method that focuses on notable lowsandmBDSR signals.
※Please note that in the charts introduced in this article, for convenience of explanation, circles, lines, rectangles, etc. may be drawn.
Indicator that shines in combination with RCI【BODSOR・mBDSR】
Methods・Case Studies (PDF) ★GogoJungle AWARD 2020 Winner★
https://www.gogojungle.co.jp/tools/indicators/11836
The PDF file includes 358 items (over 1,400 pages, over 470,000 characters).
Many of them are cases that have been compiled to logically link higher and lower timeframes by using three RCI lines, sequentially considering multiple lower-timeframe conditions, and finally waiting for a dip buy or a pullback sell timing (i.e., mBDSR signal) on the lower timeframe.
In addition,many cases focus on capturing points where multiple entry grounds coincide..
Also,the method to explore upward and downward targets using three RCI linesis included.
In the PDF explanation,are used.

Indicator【BODSOR・mBDSR】that shows its power in combination with RCI
Methods・Case Studies (PDF) ★GogoJungle AWARD 2020 Winner★
https://www.gogojungle.co.jp/tools/indicators/11836
mBDSR (RCI Filter)andmBDSR (Moving Average Filter)perform different roles. The above PDF also touches on how to use them.
Below, we introduce examples of signals formBDSR (Moving Average Filter)signals.
Gold XAUUSD 5-minute chart
On the upper 5-minute chart,noticeable lowrises up close to a notable low,the returning-sell signal of mBDSR (Moving Average Filter)lights up, and subsequently, price decisively moves down.
From this example,it shows a high affinity between a trading method that focuses on notable lowsandmBDSR signals.
※Please note that in the charts introduced in this article, for convenience of explanation, circles, lines, rectangles, etc. may be drawn.
Indicator that shines in combination with RCI【BODSOR・mBDSR】
Methods・Case Studies (PDF) ★GogoJungle AWARD 2020 Winner★
https://www.gogojungle.co.jp/tools/indicators/11836
The PDF file includes 358 items (over 1,400 pages, over 470,000 characters).
Many of them are cases that have been compiled to logically link higher and lower timeframes by using three RCI lines, sequentially considering multiple lower-timeframe conditions, and finally waiting for a dip buy or a pullback sell timing (i.e., mBDSR signal) on the lower timeframe.
In addition,many cases focus on capturing points where multiple entry grounds coincide..
Also,the method to explore upward and downward targets using three RCI linesis included.
In the PDF explanation,are used.
× ![]()


