

【mBDSR(Moving Average Filter)sell signal】Pay attention to the neckline of the double top
【Mastering RCI!! Trend Reversals, Buy on Dips, and Sell on Rallies】
Indicator 【BODSOR・mBDSR】 that shines in combination with RCI
and techniques ・ Case studies (PDF) ★GogoJungle AWARD2020 recipient★
https://www.gogojungle.co.jp/tools/indicators/11836
mBDSR (RCI Filter)andmBDSR (Moving Average Filter)play different roles. The PDF above also discusses how to use them distinctly.
Below,an example of signals for themBDSR (Moving Average Filter)
USD/JPY 5-minute chart
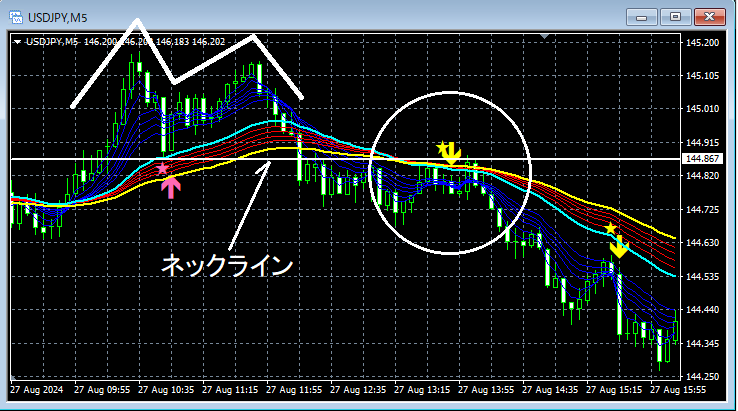
On the 5-minute chart above,the neck line of the double toprises toward it,the mBDSR sell signal on the pullbacklights up, and subsequently, price clearly moves downward.
From this example,the high compatibility between a trading approach focused on double bottoms and their neck linesandthe signals of mBDSRis evident.
※Please note that charts introduced in this article may include added circles, straight lines, or rectangles for ease of explanation.
Indicator 【BODSOR・mBDSR】 that shines in combination with RCI
and techniques ・ Case studies (PDF) ★GogoJungle AWARD2020 recipient★
https://www.gogojungle.co.jp/tools/indicators/11836
The PDF file includes 358 items (over 1,400 pages, over 470,000 words).
Most of these are designed to logically link higher and lower timeframes using three RCI lines, examining multiple lower-timeframe conditions in sequence, and ultimately waiting for entry timing on the lower timeframe dips or rallies (i.e., the signals of mBDSR).
Additionally,many entries focus on identifying points where multiple entry grounds align..
Furthermore,this includes methods for exploring upside and downside targets using the three-RCI-line approach..
In the PDF explanations,more than 1,350 chartsare used.

Indicator 【BODSOR・mBDSR】 that shines in combination with RCI
and techniques ・ Case studies (PDF) ★GogoJungle AWARD2020 recipient★
https://www.gogojungle.co.jp/tools/indicators/11836
mBDSR (RCI Filter)andmBDSR (Moving Average Filter)play different roles. The PDF above also discusses how to use them distinctly.
Below,an example of signals for themBDSR (Moving Average Filter)
USD/JPY 5-minute chart
On the 5-minute chart above,the neck line of the double toprises toward it,the mBDSR sell signal on the pullbacklights up, and subsequently, price clearly moves downward.
From this example,the high compatibility between a trading approach focused on double bottoms and their neck linesandthe signals of mBDSRis evident.
※Please note that charts introduced in this article may include added circles, straight lines, or rectangles for ease of explanation.
Indicator 【BODSOR・mBDSR】 that shines in combination with RCI
and techniques ・ Case studies (PDF) ★GogoJungle AWARD2020 recipient★
https://www.gogojungle.co.jp/tools/indicators/11836
The PDF file includes 358 items (over 1,400 pages, over 470,000 words).
Most of these are designed to logically link higher and lower timeframes using three RCI lines, examining multiple lower-timeframe conditions in sequence, and ultimately waiting for entry timing on the lower timeframe dips or rallies (i.e., the signals of mBDSR).
Additionally,many entries focus on identifying points where multiple entry grounds align..
Furthermore,this includes methods for exploring upside and downside targets using the three-RCI-line approach..
In the PDF explanations,more than 1,350 chartsare used.
× ![]()


