

【mBDSR (Moving Average Filter Buy Signal)】Pay attention to the previous resistance line
【Mastering RCI!! Trend Reversal, Buy-the-D dip, Sell-the-Rally】
Indicator that shines when combined with RCI: 【BODSOR・mBDSR】
and method & case studies (PDF) ★GogoJungle AWARD2020 winner★
https://www.gogojungle.co.jp/tools/indicators/11836
mBDSR (RCI filter)andmBDSR (Moving Average filter)have different roles. The PDF above also touches on how to use them distinctly.
Below,an example of signals for mBDSR (Moving Average filter)will be introduced.
EURUSD — Euro/Dollar 15-minute chart
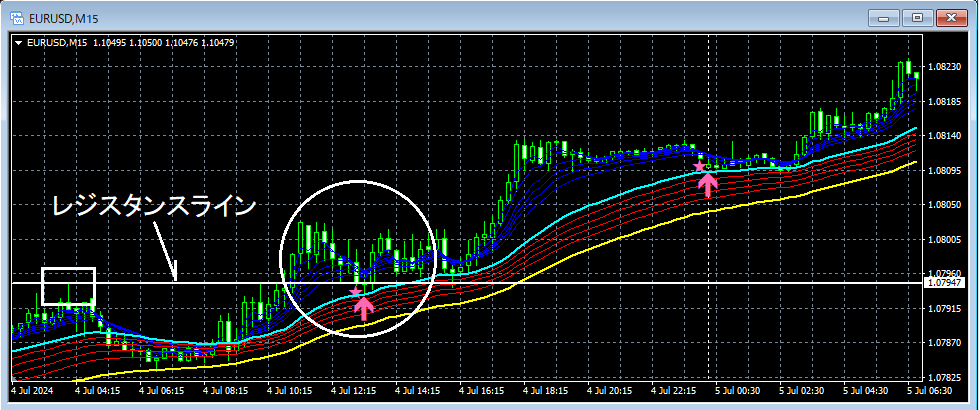
In the 15-minute chart above,the previous resistance lineis approached,the buy-the-dip signal of mBDSR (Moving Average filter)lights up, and subsequently the price rises firmly.
From this example,there is a strong compatibility between a trade method focusing on support/resistance reversalandthe signals of mBDSR.
※Please note that charts mentioned in this article may include added circles, straight lines, and rectangles for ease of explanation.
Indicator that shines when combined with RCI: 【BODSOR・mBDSR】
and method & case studies (PDF) ★GogoJungle AWARD2020 winner★
https://www.gogojungle.co.jp/tools/indicators/11836
The PDF file includes 358 items (over 1,400 pages, over 470,000 characters in total).
Most of them are compiled as examples where, by logically linking higher and lower timeframes using the RCI three-line indicator, the situations of multiple lower timeframes are considered one by one, and ultimately a timing for buying on dips or selling on rallies on the lower timeframes is waited for (i.e., the signals of mBDSR).
In addition,many entries emphasize capturing points where multiple entry reasons overlap..
Also included is a method to explore ascent and descent targets using the RCI three-line indicator.
In the PDF explanations,more than 1,350 chartsare used.

Indicator that shines when combined with RCI: 【BODSOR・mBDSR】
and method & case studies (PDF) ★GogoJungle AWARD2020 winner★
https://www.gogojungle.co.jp/tools/indicators/11836
mBDSR (RCI filter)andmBDSR (Moving Average filter)have different roles. The PDF above also touches on how to use them distinctly.
Below,an example of signals for mBDSR (Moving Average filter)will be introduced.
EURUSD — Euro/Dollar 15-minute chart
In the 15-minute chart above,the previous resistance lineis approached,the buy-the-dip signal of mBDSR (Moving Average filter)lights up, and subsequently the price rises firmly.
From this example,there is a strong compatibility between a trade method focusing on support/resistance reversalandthe signals of mBDSR.
※Please note that charts mentioned in this article may include added circles, straight lines, and rectangles for ease of explanation.
Indicator that shines when combined with RCI: 【BODSOR・mBDSR】
and method & case studies (PDF) ★GogoJungle AWARD2020 winner★
https://www.gogojungle.co.jp/tools/indicators/11836
The PDF file includes 358 items (over 1,400 pages, over 470,000 characters in total).
Most of them are compiled as examples where, by logically linking higher and lower timeframes using the RCI three-line indicator, the situations of multiple lower timeframes are considered one by one, and ultimately a timing for buying on dips or selling on rallies on the lower timeframes is waited for (i.e., the signals of mBDSR).
In addition,many entries emphasize capturing points where multiple entry reasons overlap..
Also included is a method to explore ascent and descent targets using the RCI three-line indicator.
In the PDF explanations,more than 1,350 chartsare used.
× ![]()


