

【mBDSR (Moving Average Line Filter) Buy Signal on Pullback】Focus on noticeable highs
【Mastering RCI!! Trend Reversal, Buy on Dip, Sell on Rally】
Indicator that shines in combination with RCI: 【BODSOR・mBDSR】
and method and case studies (PDF) ★GogoJungle AWARD2020 winner★
https://www.gogojungle.co.jp/tools/indicators/11836
mBDSR (RCI filter)andmBDSR (moving average filter)have different roles. The PDF above also touches on how to use them distinctly.
Below,mBDSR (moving average filter)signs will be introduced as examples.
Swiss Franc / Japanese Yen CHFJPY 1-hour chart
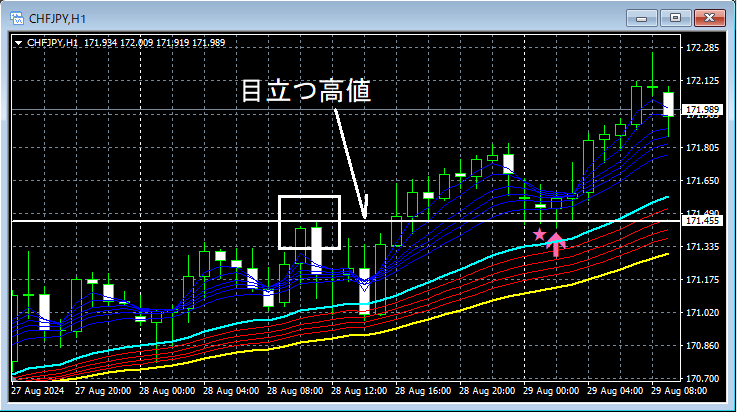
In the above 1-hour chart,clear highsare near the area where it has fallen tomBDSR (moving average filter) buy-on-dip signallights up, and subsequently, the price rises firmly.
From this example,the highs or resistance/support reversals (roll reversals) focused trading methodandmBDSR signalshow a strong compatibility.
※Note: In the charts introduced in this article, for ease of explanation, circles, lines, and rectangles may be added.
Indicator that shines in combination with RCI: 【BODSOR・mBDSR】
and method and case studies (PDF) ★GogoJungle AWARD2020 winner★
https://www.gogojungle.co.jp/tools/indicators/11836
The PDF file includes 358 items (over 1,400 pages, over 470,000 characters in total).
Many of them are a compilation of examples that logically link higher and lower timeframes using three RCI lines to analyze multiple lower-timeframe conditions step by step, ultimately waiting for buy-on-dip or sell-on-rally timings (i.e., mBDSR signals) on the lower timeframe.
Additionally,there are many that emphasize capturing points where multiple entry reasons overlap..
Furthermore,there are methods that explore upward and downward targets using the three RCI lines..
In the PDF explanations,over 1,350 chartsare used.

Indicator that shines in combination with RCI: 【BODSOR・mBDSR】
and method and case studies (PDF) ★GogoJungle AWARD2020 winner★
https://www.gogojungle.co.jp/tools/indicators/11836
mBDSR (RCI filter)andmBDSR (moving average filter)have different roles. The PDF above also touches on how to use them distinctly.
Below,mBDSR (moving average filter)signs will be introduced as examples.
Swiss Franc / Japanese Yen CHFJPY 1-hour chart
In the above 1-hour chart,clear highsare near the area where it has fallen tomBDSR (moving average filter) buy-on-dip signallights up, and subsequently, the price rises firmly.
From this example,the highs or resistance/support reversals (roll reversals) focused trading methodandmBDSR signalshow a strong compatibility.
※Note: In the charts introduced in this article, for ease of explanation, circles, lines, and rectangles may be added.
Indicator that shines in combination with RCI: 【BODSOR・mBDSR】
and method and case studies (PDF) ★GogoJungle AWARD2020 winner★
https://www.gogojungle.co.jp/tools/indicators/11836
The PDF file includes 358 items (over 1,400 pages, over 470,000 characters in total).
Many of them are a compilation of examples that logically link higher and lower timeframes using three RCI lines to analyze multiple lower-timeframe conditions step by step, ultimately waiting for buy-on-dip or sell-on-rally timings (i.e., mBDSR signals) on the lower timeframe.
Additionally,there are many that emphasize capturing points where multiple entry reasons overlap..
Furthermore,there are methods that explore upward and downward targets using the three RCI lines..
In the PDF explanations,over 1,350 chartsare used.
× ![]()


