

【mBDSR (Moving Average Filter) Reversal Sell Signal】Focus on past support lines
【Mastering RCI!! Trend Reversal, Buy on Dips, Sell on Rallies】
Indicator 【BODSOR・mBDSR】 that proves powerful in combination with RCI
Method & Case Studies (PDF) ★GogoJungle AWARD 2020 Winner★
https://www.gogojungle.co.jp/tools/indicators/11836
mBDSR (RCI Filter)andmBDSR (Moving Average Filter)serve different roles. The above PDF also discusses how to use them.
Below,mBDSR (Moving Average Filter)signs will be introduced as examples.
AUDCHF Australia/U.K. pair, 5-minute chart
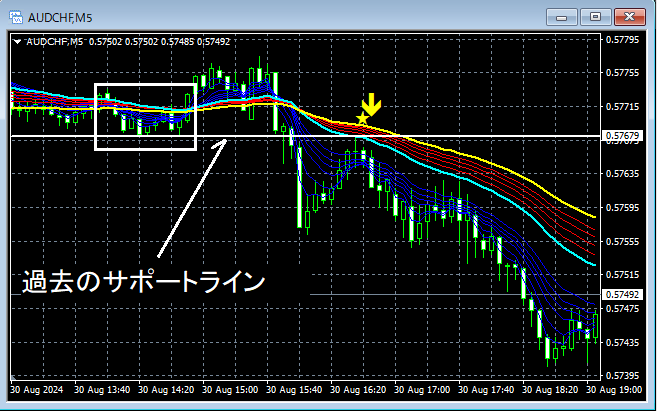
In the above 5-minute chart,near the past support lineit rises to,mBDSR (Moving Average Filter) sell signallights up, and afterward the price declines steadily.
From this example,a trading method focusing on Support/Resistance turn (roll reversal)andthe harmony with mBDSR signalsis evident.
※Please note that in the charts introduced in this article, for readability, circles, lines, and rectangles may be drawn.
Indicator that shines in combination with RCI: 【BODSOR・mBDSR】
Method & Case Studies (PDF) ★GogoJungle AWARD 2020 Winner★
https://www.gogojungle.co.jp/tools/indicators/11836
The PDF file contains 358 items (over 1,400 pages, over 470,000 characters).
Most of them are compiled as examples showing how to logically link multiple higher and lower timeframes using three RCI lines, eventually waiting for dips or pullbacks timing (=mBDSR signs) on the lower timeframe.Additionally,
many focus on identifying points where multiple entry justifications coincide.There are also many instances included.
Furthermore,the method exploring upside and downside targets using three RCI linesis included.
In the PDF descriptions,more than 1,350 chartsare used.

Indicator 【BODSOR・mBDSR】 that proves powerful in combination with RCI
Method & Case Studies (PDF) ★GogoJungle AWARD 2020 Winner★
https://www.gogojungle.co.jp/tools/indicators/11836
mBDSR (RCI Filter)andmBDSR (Moving Average Filter)serve different roles. The above PDF also discusses how to use them.
Below,mBDSR (Moving Average Filter)signs will be introduced as examples.
AUDCHF Australia/U.K. pair, 5-minute chart
In the above 5-minute chart,near the past support lineit rises to,mBDSR (Moving Average Filter) sell signallights up, and afterward the price declines steadily.
From this example,a trading method focusing on Support/Resistance turn (roll reversal)andthe harmony with mBDSR signalsis evident.
※Please note that in the charts introduced in this article, for readability, circles, lines, and rectangles may be drawn.
Indicator that shines in combination with RCI: 【BODSOR・mBDSR】
Method & Case Studies (PDF) ★GogoJungle AWARD 2020 Winner★
https://www.gogojungle.co.jp/tools/indicators/11836
The PDF file contains 358 items (over 1,400 pages, over 470,000 characters).
Most of them are compiled as examples showing how to logically link multiple higher and lower timeframes using three RCI lines, eventually waiting for dips or pullbacks timing (=mBDSR signs) on the lower timeframe.Additionally,
many focus on identifying points where multiple entry justifications coincide.There are also many instances included.
Furthermore,the method exploring upside and downside targets using three RCI linesis included.
In the PDF descriptions,more than 1,350 chartsare used.
× ![]()


