

【mBDSR (Moving Average Line Filter) Reversal Sell Signal】Focus on noticeable lows
0
【Mastering RCI!! Trend Reversal, Buy on Dips, Sell on Rallies】
Indicator 【BODSOR・mBDSR】 that shines when used in combination with RCI
and methods / case studies (PDF) ★GogoJungle AWARD 2020 winner★
https://www.gogojungle.co.jp/tools/indicators/11836
mBDSR (RCI filter)andmBDSR (Moving Average filter)have different roles. The PDF above also touches on how to use these appropriately.
Below we introducemBDSR (Moving Average filter)signal examples.
USDCHF, 4-hour chart
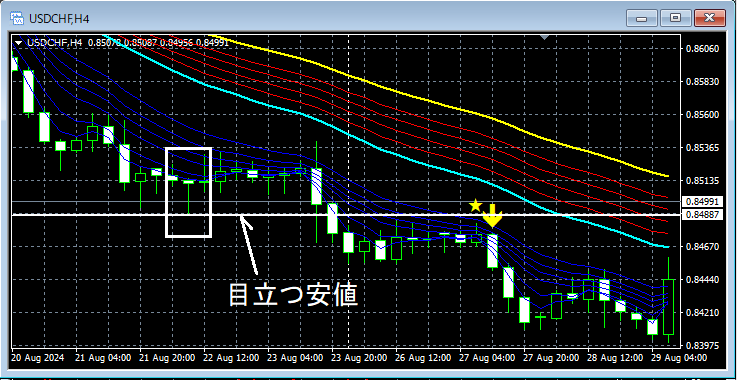
In the above 4-hour chart,a pronounced lowrises close to the area,the mBDSR moving average filter sell signallights up, and subsequently the price declines firmly.
From this example,a trading approach focused on noticeable lows and support/resistance reversals (roll reversals)and thesignal of mBDSRshow strong compatibility.
※Please note that in the charts introduced in this article, for ease of explanation, circles, straight lines, and squares may have been added.
Indicator 【BODSOR・mBDSR】 that shines when used in combination with RCI
methods / case studies (PDF) ★GogoJungle AWARD 2020 winner★
https://www.gogojungle.co.jp/tools/indicators/11836
The PDF file includes 358 files (over 1,400 pages, over 470,000 words in total).
Many of these are compiled as examples that use the three RCI lines to logically link higher and lower timeframes, examining the multiple lower timeframe conditions sequentially and ultimately waiting for the dips or pullbacks timing (i.e., the mBDSR signal) on the lower timeframes.
Additionally,there are many that emphasize identifying points where multiple entry reasons coincide..
Note thatthere are also methods that explore upside and downside targets using the three RCI lines..
In the explanations within the PDF file,more than 1,350 chartsare used.

Indicator 【BODSOR・mBDSR】 that shines when used in combination with RCI
and methods / case studies (PDF) ★GogoJungle AWARD 2020 winner★
https://www.gogojungle.co.jp/tools/indicators/11836
mBDSR (RCI filter)andmBDSR (Moving Average filter)have different roles. The PDF above also touches on how to use these appropriately.
Below we introducemBDSR (Moving Average filter)signal examples.
USDCHF, 4-hour chart
In the above 4-hour chart,a pronounced lowrises close to the area,the mBDSR moving average filter sell signallights up, and subsequently the price declines firmly.
From this example,a trading approach focused on noticeable lows and support/resistance reversals (roll reversals)and thesignal of mBDSRshow strong compatibility.
※Please note that in the charts introduced in this article, for ease of explanation, circles, straight lines, and squares may have been added.
Indicator 【BODSOR・mBDSR】 that shines when used in combination with RCI
methods / case studies (PDF) ★GogoJungle AWARD 2020 winner★
https://www.gogojungle.co.jp/tools/indicators/11836
The PDF file includes 358 files (over 1,400 pages, over 470,000 words in total).
Many of these are compiled as examples that use the three RCI lines to logically link higher and lower timeframes, examining the multiple lower timeframe conditions sequentially and ultimately waiting for the dips or pullbacks timing (i.e., the mBDSR signal) on the lower timeframes.
Additionally,there are many that emphasize identifying points where multiple entry reasons coincide..
Note thatthere are also methods that explore upside and downside targets using the three RCI lines..
In the explanations within the PDF file,more than 1,350 chartsare used.
× ![]()


