

Important moving average gold cross and mBDSR (RCI two-filter) pullback buying signal
0
【Mastering RCI!! Trend Reversal, Buy the Dip, Sell the Rally】
Indicator that shines in combination with RCI: 【BODSOR・mBDSR】
and methods・case studies (PDF) ★GogoJungle AWARD2020 winner★
https://www.gogojungle.co.jp/tools/indicators/11836
GBPJPY – 30-minute chart
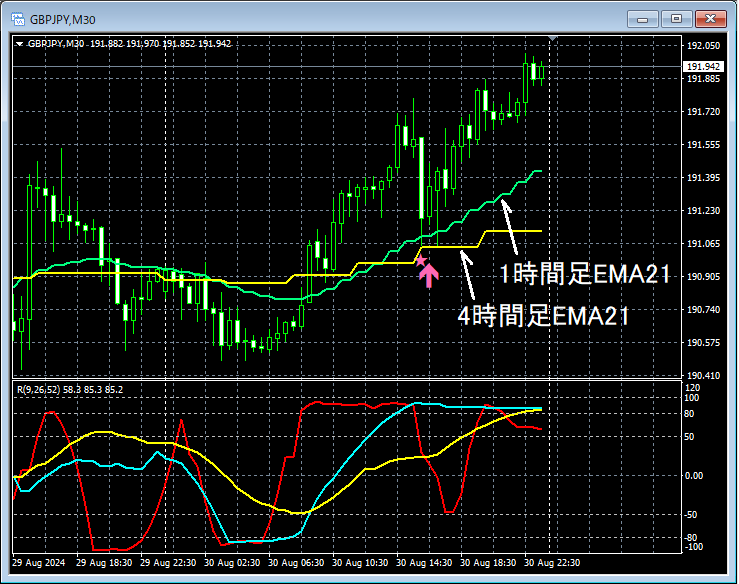
On the upper 30-minute chart,4-hour EMA21and1-hour EMA21golden cross, then theymoving averagesdraw near to the pricemBDSR (RCI two-filter) buy-the-dip signallights up, and afterward, the price rises steadily.
From this example,a trading method focused on the golden cross of moving averagesand thesignals of mBDSRshow a high degree of compatibility.
※Please note that in the charts introduced in this article, for ease of explanation, circles, straight lines, and squares may have been added.
Indicator that shines in combination with RCI: 【BODSOR・mBDSR】
and methods・case studies (PDF) ★GogoJungle AWARD2020 winner★
https://www.gogojungle.co.jp/tools/indicators/11836
The PDF file includes 358 items (over 1,400 pages, over 470,000 characters in total).
Many of these are compiled as examples that link higher-timeframe and lower-timeframe logically using three RCI lines to examine multiple lower-timeframe conditions sequentially, ultimately waiting for buy-the-dip or sell-the-rally timings on the lower timeframe (i.e., the signals of mBDSR).
Also,there are many that emphasize identifying points where multiple entry reasons align..
Additionally,there are methods that explore upward and downward targets using three RCI lines..
In the explanations within the PDF files,more than 1,350 chartsare used.

Indicator that shines in combination with RCI: 【BODSOR・mBDSR】
and methods・case studies (PDF) ★GogoJungle AWARD2020 winner★
https://www.gogojungle.co.jp/tools/indicators/11836
GBPJPY – 30-minute chart
On the upper 30-minute chart,4-hour EMA21and1-hour EMA21golden cross, then theymoving averagesdraw near to the pricemBDSR (RCI two-filter) buy-the-dip signallights up, and afterward, the price rises steadily.
From this example,a trading method focused on the golden cross of moving averagesand thesignals of mBDSRshow a high degree of compatibility.
※Please note that in the charts introduced in this article, for ease of explanation, circles, straight lines, and squares may have been added.
Indicator that shines in combination with RCI: 【BODSOR・mBDSR】
and methods・case studies (PDF) ★GogoJungle AWARD2020 winner★
https://www.gogojungle.co.jp/tools/indicators/11836
The PDF file includes 358 items (over 1,400 pages, over 470,000 characters in total).
Many of these are compiled as examples that link higher-timeframe and lower-timeframe logically using three RCI lines to examine multiple lower-timeframe conditions sequentially, ultimately waiting for buy-the-dip or sell-the-rally timings on the lower timeframe (i.e., the signals of mBDSR).
Also,there are many that emphasize identifying points where multiple entry reasons align..
Additionally,there are methods that explore upward and downward targets using three RCI lines..
In the explanations within the PDF files,more than 1,350 chartsare used.
× ![]()


