

The important moving average line and the mBDSR (RCI two-filter) signal (2)
0
【Mastering RCI!! Trend Reversal, Buy on Dips, Sell on Rallies】
Indicator that shines when combined with RCI: 【BODSOR・mBDSR】
Methods and case studies (PDF) ★GogoJungle AWARD 2020 Winner★
https://www.gogojungle.co.jp/tools/indicators/11836
New Zealand Yen NZDJPY 30-minute chart
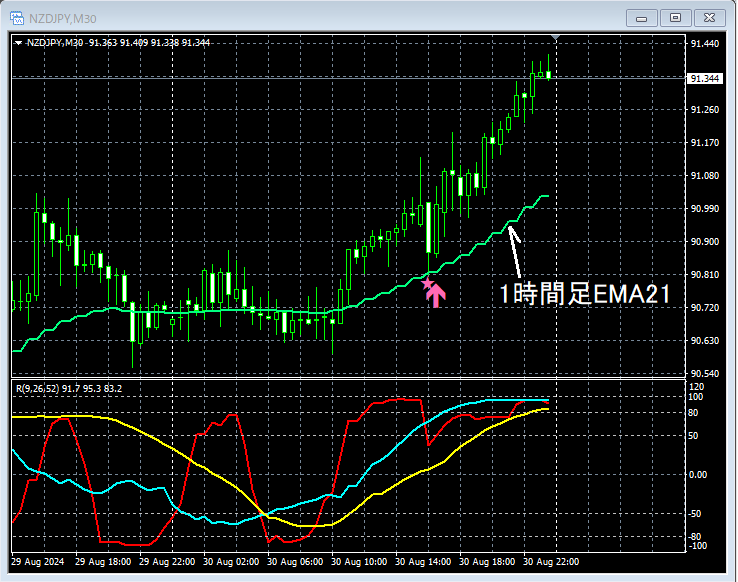
The situation on the higher timeframe is omitted. On the 30-minute chart above, what is considered important1-hour EMA21has declined to near the vicinity ofmBDSR (RCI two-line filter) buy-the-dip signallights up and the price rises steadily.
From this example,a trading method that focuses on the important moving averagesandthe signals of mBDSRshow a high degree of compatibility.
※Please note that on the charts introduced in this article, for convenience of explanation, circles, straight lines, and rectangles may have been added.
Indicator that shines when combined with RCI: 【BODSOR・mBDSR】
Methods and case studies (PDF) ★GogoJungle AWARD 2020 Winner★
https://www.gogojungle.co.jp/tools/indicators/11836
The PDF file includes 358 files (over 1,400 pages, over 470,000 characters).
Most of them are abouthow to logically link higher and lower timeframes using the three-line RCI to sequentially examine multiple lower-timeframe conditions, and ultimately wait for a dip-buy or pullback-sell timing (i.e., the mBDSR signals) on the lower timeframe.
Also,many focus on identifying points where multiple entry reasons coincide.
Additionally,there are methods that explore upward and downward targets using the three-line RCIas well.
In the explanations within the PDF files,more than 1,350 chartsare used.

Indicator that shines when combined with RCI: 【BODSOR・mBDSR】
Methods and case studies (PDF) ★GogoJungle AWARD 2020 Winner★
https://www.gogojungle.co.jp/tools/indicators/11836
New Zealand Yen NZDJPY 30-minute chart
The situation on the higher timeframe is omitted. On the 30-minute chart above, what is considered important1-hour EMA21has declined to near the vicinity ofmBDSR (RCI two-line filter) buy-the-dip signallights up and the price rises steadily.
From this example,a trading method that focuses on the important moving averagesandthe signals of mBDSRshow a high degree of compatibility.
※Please note that on the charts introduced in this article, for convenience of explanation, circles, straight lines, and rectangles may have been added.
Indicator that shines when combined with RCI: 【BODSOR・mBDSR】
Methods and case studies (PDF) ★GogoJungle AWARD 2020 Winner★
https://www.gogojungle.co.jp/tools/indicators/11836
The PDF file includes 358 files (over 1,400 pages, over 470,000 characters).
Most of them are abouthow to logically link higher and lower timeframes using the three-line RCI to sequentially examine multiple lower-timeframe conditions, and ultimately wait for a dip-buy or pullback-sell timing (i.e., the mBDSR signals) on the lower timeframe.
Also,many focus on identifying points where multiple entry reasons coincide.
Additionally,there are methods that explore upward and downward targets using the three-line RCIas well.
In the explanations within the PDF files,more than 1,350 chartsare used.
× ![]()


