

Significance of the moving average line we value and the mBDSR (RCI two-filter) signal (1)
0
【Mastering RCI!! Trend Reversal • Buy on Pullbacks • Sell on Rallies】
Indicator that shines in combination with RCI: 【BODSOR・mBDSR】
Methods・Case Studies (PDF) ★GogoJungle AWARD 2020 Winner★
https://www.gogojungle.co.jp/tools/indicators/11836
New Zealand Yen NZDJPY 15-minute chart
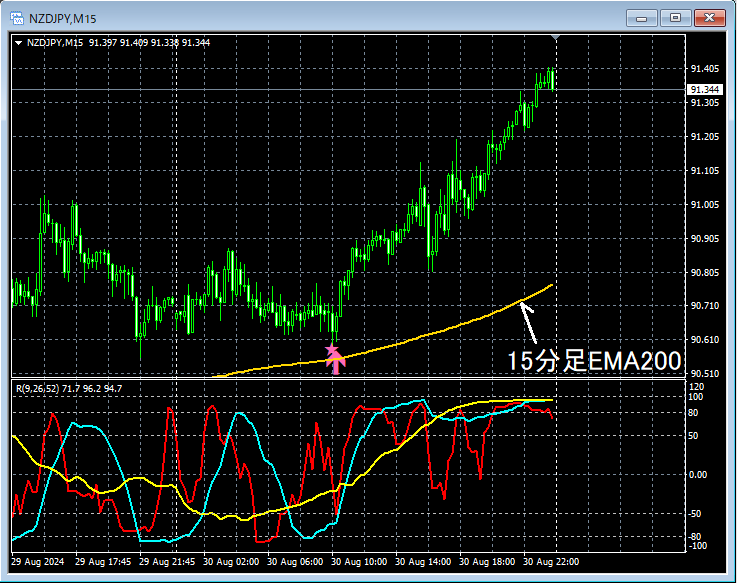
The higher-timeframe context is omitted. On the upper 15-minute chart, what is considered important15-minute EMA200has dropped toward the vicinity ofmBDSR (two RCI lines filter) pullback buy signallights up and price continues to rise firmly.
From this example,a trading method focused on the important moving averagesandthe signals of mBDSRshow a high degree of compatibility.
※Please note that in the charts introduced in this article, for clarity, circles, lines, and rectangles may be drawn.
Indicator that shines in combination with RCI: 【BODSOR・mBDSR】
Methods・Case Studies (PDF) ★GogoJungle AWARD 2020 Winner★
https://www.gogojungle.co.jp/tools/indicators/11836
PDF files are attached: 358 PDFs (over 1,400 pages, over 470,000 characters total).
Many of themare summaries of examples that logically link higher and lower timeframes by using three RCI lines, and finally wait for pullbacks or rallies on the lower timeframe signals (mBDSR).
Additionally,there are many that focus on capturing points where multiple entry rationales overlap.
Also included is a method for exploring upward or downward targets using three RCI lines.
In the PDF file descriptions,over 1,350 chartsare used.

Indicator that shines in combination with RCI: 【BODSOR・mBDSR】
Methods・Case Studies (PDF) ★GogoJungle AWARD 2020 Winner★
https://www.gogojungle.co.jp/tools/indicators/11836
New Zealand Yen NZDJPY 15-minute chart
The higher-timeframe context is omitted. On the upper 15-minute chart, what is considered important15-minute EMA200has dropped toward the vicinity ofmBDSR (two RCI lines filter) pullback buy signallights up and price continues to rise firmly.
From this example,a trading method focused on the important moving averagesandthe signals of mBDSRshow a high degree of compatibility.
※Please note that in the charts introduced in this article, for clarity, circles, lines, and rectangles may be drawn.
Indicator that shines in combination with RCI: 【BODSOR・mBDSR】
Methods・Case Studies (PDF) ★GogoJungle AWARD 2020 Winner★
https://www.gogojungle.co.jp/tools/indicators/11836
PDF files are attached: 358 PDFs (over 1,400 pages, over 470,000 characters total).
Many of themare summaries of examples that logically link higher and lower timeframes by using three RCI lines, and finally wait for pullbacks or rallies on the lower timeframe signals (mBDSR).
Additionally,there are many that focus on capturing points where multiple entry rationales overlap.
Also included is a method for exploring upward or downward targets using three RCI lines.
In the PDF file descriptions,over 1,350 chartsare used.
× ![]()


