

Past notable highs on the higher timeframe and pullback buy signal of mBDSR (RCI2-band filter)
0
【Mastering RCI!! Trend Reversal, Buy-the-Dip, and Sell-Rally】
Indicator that shines in combination with RCI: 【BODSOR・mBDSR】
and methodologies and case studies (PDF) ★GogoJungle AWARD2020 Winner★
https://www.gogojungle.co.jp/tools/indicators/11836
Swiss Franc / JPY CHFJPY 1-minute chart
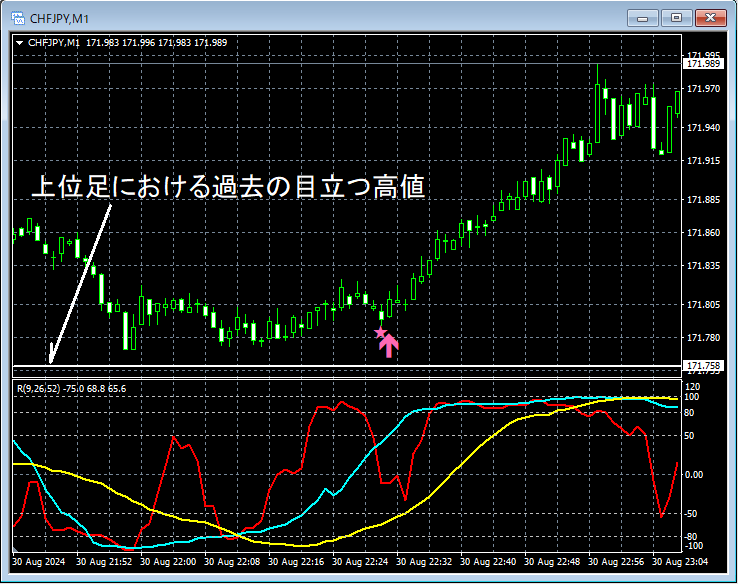
The status of the higher timeframe is omitted. On the 1-minute chart above,Past notable highs on the higher timeframehave been approached,mBDSR (RCI two-line filter)buy-the-dip signal lights up, and the price rises sharply.
From this example,a trading method focused on past notable highsandthe signal of mBDSRshow a strong compatibility.
Also in this example, by placing the stop-loss just below the recent low,a high risk-reward tradeis possible.
※Please note that, for convenience of explanation, some charts in this article may have circles, straight lines, or squares drawn on them.
Indicator that shines in combination with RCI【BODSOR・mBDSR】
and methodology & case studies (PDF) ★GogoJungle AWARD2020 Winner★
https://www.gogojungle.co.jp/tools/indicators/11836
The PDF file includes 358 files (over 1,400 pages, over 470,000 characters in total).
Most of them aresummaries of cases where RCI three-line is used to logically link higher and lower timeframes, sequentially examining the状況 of multiple lower timeframes, and ultimately waiting for pullbacks or rallies on the lower timeframes (i.e., the signals from mBDSR)..
Additionally,many focus on identifying points where multiple entry reasons overlap..
Furthermore,it also includes a method to explore upside/downside targets using the three-line RCI..
In the explanation within the PDF files,more than 1,350 chartsare used.

Indicator that shines in combination with RCI: 【BODSOR・mBDSR】
and methodologies and case studies (PDF) ★GogoJungle AWARD2020 Winner★
https://www.gogojungle.co.jp/tools/indicators/11836
Swiss Franc / JPY CHFJPY 1-minute chart
The status of the higher timeframe is omitted. On the 1-minute chart above,Past notable highs on the higher timeframehave been approached,mBDSR (RCI two-line filter)buy-the-dip signal lights up, and the price rises sharply.
From this example,a trading method focused on past notable highsandthe signal of mBDSRshow a strong compatibility.
Also in this example, by placing the stop-loss just below the recent low,a high risk-reward tradeis possible.
※Please note that, for convenience of explanation, some charts in this article may have circles, straight lines, or squares drawn on them.
Indicator that shines in combination with RCI【BODSOR・mBDSR】
and methodology & case studies (PDF) ★GogoJungle AWARD2020 Winner★
https://www.gogojungle.co.jp/tools/indicators/11836
The PDF file includes 358 files (over 1,400 pages, over 470,000 characters in total).
Most of them aresummaries of cases where RCI three-line is used to logically link higher and lower timeframes, sequentially examining the状況 of multiple lower timeframes, and ultimately waiting for pullbacks or rallies on the lower timeframes (i.e., the signals from mBDSR)..
Additionally,many focus on identifying points where multiple entry reasons overlap..
Furthermore,it also includes a method to explore upside/downside targets using the three-line RCI..
In the explanation within the PDF files,more than 1,350 chartsare used.
× ![]()


