

[mBDSR (Moving Average Filter) Buy Signal on Pullback] Pay attention to the retracement high
0
【Mastering RCI!! Trend Reversal, Pullback Buying, and Pullback Selling】
Indicator that shines in combination with RCI【BODSOR・mBDSR】
Methods, and Case Studies (PDF) ★GogoJungle AWARD2020 Winner★
https://www.gogojungle.co.jp/tools/indicators/11836
mBDSR (RCI Filter)andmBDSR (Moving Average Filter)have different roles. The corresponding usage is also touched upon in the above PDF.
Below,mBDSR (Moving Average Filter)sign examples will be introduced.
Swiss Franc / Japanese Yen CHFJPY 15-minute chart
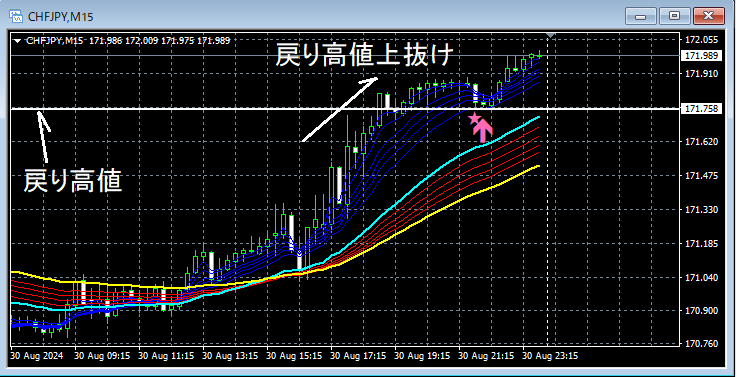
On the 15-minute chart above,a pullback highwas breached, and near thatpullback higharea,mBDSR (Moving Average Filter) pullback buy signallit up, and afterward, the price rose.
From this example,a trading method focusing on pullback highs (Dow Theory)and thesignal of mBDSRshow strong compatibility.
*Please note that in the charts introduced in this article, for convenience of explanation, circles, lines, and rectangles may be drawn.
Indicator that shines in combination with RCI【BODSOR・mBDSR】
Methods, and Case Studies (PDF) ★GogoJungle AWARD2020 Winner★
https://www.gogojungle.co.jp/tools/indicators/11836
The PDF file includes 358 items (over 1,400 pages, over 470,000 characters).
Many of these are shaped to consider multiple lower timeframes logically by linking the higher and lower timeframes using the RCI3-line, ultimately waiting for pullback buying or pullback selling timing (i.e., mBDSR signal) on the lower timeframe.
Also,there are many pieces that focus on capturing points where multiple entry reasons overlap..
Additionally,there are methods that explore upside and downside targets using the RCI3-line..
In the PDF, the explanations usemore than 1,350 charts.

Indicator that shines in combination with RCI【BODSOR・mBDSR】
Methods, and Case Studies (PDF) ★GogoJungle AWARD2020 Winner★
https://www.gogojungle.co.jp/tools/indicators/11836
mBDSR (RCI Filter)andmBDSR (Moving Average Filter)have different roles. The corresponding usage is also touched upon in the above PDF.
Below,mBDSR (Moving Average Filter)sign examples will be introduced.
Swiss Franc / Japanese Yen CHFJPY 15-minute chart
On the 15-minute chart above,a pullback highwas breached, and near thatpullback higharea,mBDSR (Moving Average Filter) pullback buy signallit up, and afterward, the price rose.
From this example,a trading method focusing on pullback highs (Dow Theory)and thesignal of mBDSRshow strong compatibility.
*Please note that in the charts introduced in this article, for convenience of explanation, circles, lines, and rectangles may be drawn.
Indicator that shines in combination with RCI【BODSOR・mBDSR】
Methods, and Case Studies (PDF) ★GogoJungle AWARD2020 Winner★
https://www.gogojungle.co.jp/tools/indicators/11836
The PDF file includes 358 items (over 1,400 pages, over 470,000 characters).
Many of these are shaped to consider multiple lower timeframes logically by linking the higher and lower timeframes using the RCI3-line, ultimately waiting for pullback buying or pullback selling timing (i.e., mBDSR signal) on the lower timeframe.
Also,there are many pieces that focus on capturing points where multiple entry reasons overlap..
Additionally,there are methods that explore upside and downside targets using the RCI3-line..
In the PDF, the explanations usemore than 1,350 charts.
× ![]()


