

[Mass Psychology] Pin Bar and 2B Reversal and mBDSR (RCI2 two-filter) Sell Signal (3)
0
【Master RCI!! Trend Reversals, Buy on Dips, Sell on Rallies】
Indicator【BODSOR・mBDSR】that delivers power in combination with RCI
Methods & Case Studies (PDF) ★GogoJungle AWARD 2020 Winner★
https://www.gogojungle.co.jp/tools/indicators/11836
AUD/USD 1-Hour Chart
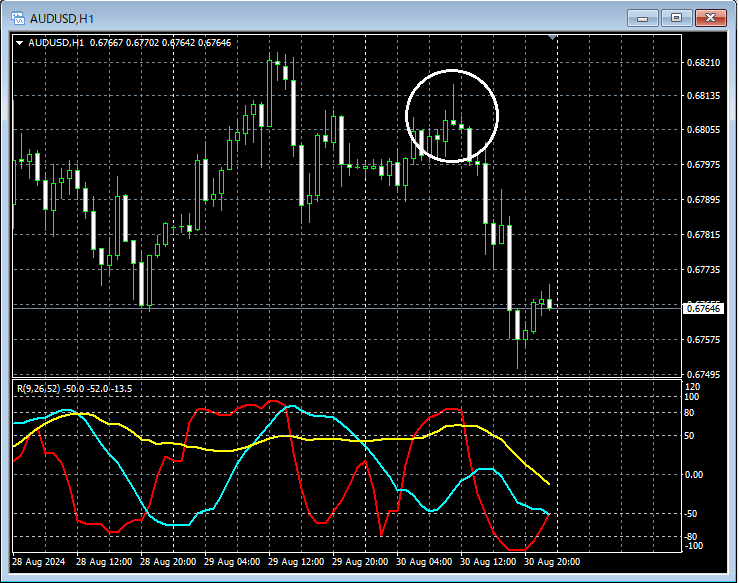
Looking at the area circled in white on the 1-hour chart above, it suggests a declinePin Bar(a candlestick with a long upper shadow) appears, and it may not be unusual to consider selling on rallies on a lower timeframe. In this casePin Baris a pattern where traders who jumped on a strong rise get trapped. Public sentiment is interpreted as turning downward (bearish).
AUD/USD 30-Minute Chart
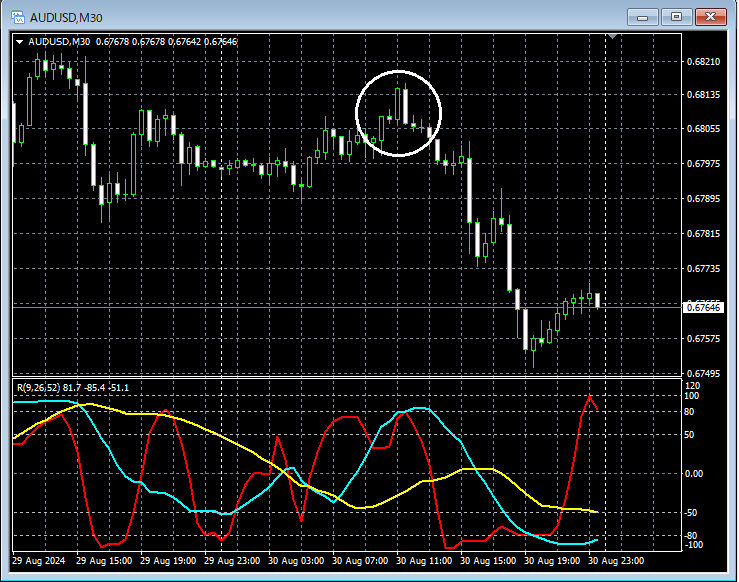
Looking at the area circled in white on the 30-minute chart above, it suggests a decline2B Reversal (Two Bar Reversal)is appearing, and it may not be strange to consider selling on rallies on the lower timeframe. In this case2B Reversal (Two Bar Reversal)is a pattern where traders who jumped on a strong rise get trapped. Public sentiment is interpreted as turning downward (bearish).
AUD/USD 5-Minute Chart
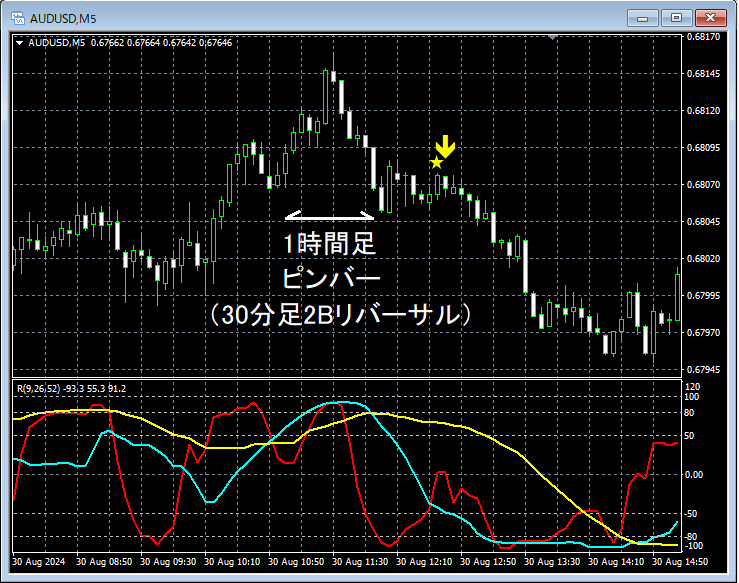
On the 5-minute chart above, on the 1-hour chartPin Baris present, while on the 30-minute chart2B Reversal (Two Bar Reversal)appears, and thenmBDSR (Two RCI lines filter) Sell-on-Rally signallights up and the downtrend resumes.
From this example,a trading approach focused on Pin Bars and 2B Reversals (trading based on public sentiment)and themBDSR signalsshow a strong compatibility.
※Please note that in the charts presented in this article, for convenience of explanation, circles, straight lines, and squares may have been added.
Indicator that delivers power in combination with RCI【BODSOR・mBDSR】
Methods & Case Studies (PDF) ★GogoJungle AWARD 2020 Winner★
https://www.gogojungle.co.jp/tools/indicators/11836
The PDF file includes 358 items (over 1,400 pages, over 470,000 characters).
Many of them are about summarizing how to logically link higher and lower timeframes using three RCI lines to examine multiple lower timeframes sequentially, and ultimately wait for a dip-buy or pullback timing on the lower timeframes (i.e., the mBDSR signal).
Additionally,there are many that focus on identifying points where multiple entry justification points overlap..
Also included is a method for exploring upside and downside targets using three RCI lines.
In the explanations within the PDF files,more than 1,350 chartsare used.

Indicator【BODSOR・mBDSR】that delivers power in combination with RCI
Methods & Case Studies (PDF) ★GogoJungle AWARD 2020 Winner★
https://www.gogojungle.co.jp/tools/indicators/11836
AUD/USD 1-Hour Chart
Looking at the area circled in white on the 1-hour chart above, it suggests a declinePin Bar(a candlestick with a long upper shadow) appears, and it may not be unusual to consider selling on rallies on a lower timeframe. In this casePin Baris a pattern where traders who jumped on a strong rise get trapped. Public sentiment is interpreted as turning downward (bearish).
AUD/USD 30-Minute Chart
Looking at the area circled in white on the 30-minute chart above, it suggests a decline2B Reversal (Two Bar Reversal)is appearing, and it may not be strange to consider selling on rallies on the lower timeframe. In this case2B Reversal (Two Bar Reversal)is a pattern where traders who jumped on a strong rise get trapped. Public sentiment is interpreted as turning downward (bearish).
AUD/USD 5-Minute Chart
On the 5-minute chart above, on the 1-hour chartPin Baris present, while on the 30-minute chart2B Reversal (Two Bar Reversal)appears, and thenmBDSR (Two RCI lines filter) Sell-on-Rally signallights up and the downtrend resumes.
From this example,a trading approach focused on Pin Bars and 2B Reversals (trading based on public sentiment)and themBDSR signalsshow a strong compatibility.
※Please note that in the charts presented in this article, for convenience of explanation, circles, straight lines, and squares may have been added.
Indicator that delivers power in combination with RCI【BODSOR・mBDSR】
Methods & Case Studies (PDF) ★GogoJungle AWARD 2020 Winner★
https://www.gogojungle.co.jp/tools/indicators/11836
The PDF file includes 358 items (over 1,400 pages, over 470,000 characters).
Many of them are about summarizing how to logically link higher and lower timeframes using three RCI lines to examine multiple lower timeframes sequentially, and ultimately wait for a dip-buy or pullback timing on the lower timeframes (i.e., the mBDSR signal).
Additionally,there are many that focus on identifying points where multiple entry justification points overlap..
Also included is a method for exploring upside and downside targets using three RCI lines.
In the explanations within the PDF files,more than 1,350 chartsare used.
× ![]()


