

From yesterday's USD/JPY chart (August 30, 2024): 【If you are following the trend...】 signals from mBDSR (Moving Average Filter) and GMMA
Indicator that captures “bottom/top reversal” when combined with RCI【mBDSR】
Methods & Case Studies (PDF) ★GogoJungle AWARD2020 winner★
https://www.gogojungle.co.jp/tools/indicators/11836
The above product includes 301 PDFs (methods, case studies, etc.). For a list of their PDF titles, please refer to the article below.
About the 301 PDF files included with 【BODSOR・mBDSR】
https://www.gogojungle.co.jp/finance/navi/articles/34271
mBDSR (RCI filter)andmBDSR (Moving Average filter)have different roles. The usage distinctions are also discussed in the above PDFs.
Below,about the signals of the moving average filter mBDSRwill be shown.
USD/JPY 15-minute chart
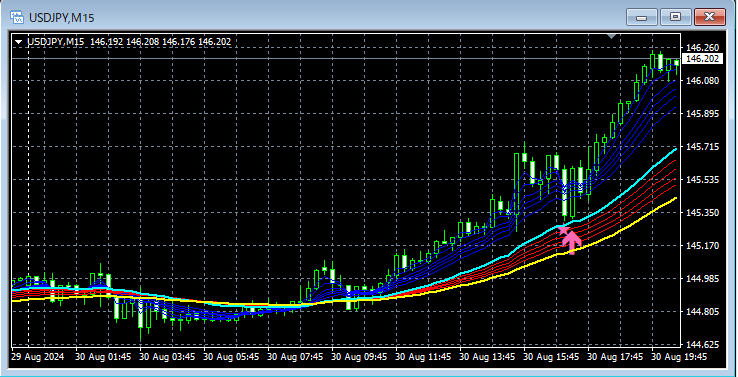
Signals of mBDSR (two moving average filters)andGMMA
An indicator that shines in combination with RCI: 【BODSOR・mBDSR】
Methods & Case Studies (PDF) ★GogoJungle AWARD2020 winner★
https://www.gogojungle.co.jp/tools/indicators/11836
The PDF files amount to 301 (over 1,000 pages, over 350,000 characters).
Many of them explain how, by using three RCI lines to logically link higher and lower timeframes, multiple lower-timeframe conditions are sequentially considered, ultimately waiting for pullbacks in the lower timeframes (i.e., mBDSR signals) to time buy at dips or sell on rallies.This is the essence captured in the examples.
Additionally,many focus on identifying points where multiple entry signals overlap..
In the explanations, over 1,000 charts are used.

Methods & Case Studies (PDF) ★GogoJungle AWARD2020 winner★
https://www.gogojungle.co.jp/tools/indicators/11836
The above product includes 301 PDFs (methods, case studies, etc.). For a list of their PDF titles, please refer to the article below.
About the 301 PDF files included with 【BODSOR・mBDSR】
https://www.gogojungle.co.jp/finance/navi/articles/34271
mBDSR (RCI filter)andmBDSR (Moving Average filter)have different roles. The usage distinctions are also discussed in the above PDFs.
Below,about the signals of the moving average filter mBDSRwill be shown.
USD/JPY 15-minute chart
Signals of mBDSR (two moving average filters)andGMMA
An indicator that shines in combination with RCI: 【BODSOR・mBDSR】
Methods & Case Studies (PDF) ★GogoJungle AWARD2020 winner★
https://www.gogojungle.co.jp/tools/indicators/11836
The PDF files amount to 301 (over 1,000 pages, over 350,000 characters).
Many of them explain how, by using three RCI lines to logically link higher and lower timeframes, multiple lower-timeframe conditions are sequentially considered, ultimately waiting for pullbacks in the lower timeframes (i.e., mBDSR signals) to time buy at dips or sell on rallies.This is the essence captured in the examples.
Additionally,many focus on identifying points where multiple entry signals overlap..
In the explanations, over 1,000 charts are used.
× ![]()


