

The importance of filtering from higher timeframe to lower timeframe and the sign of mBDSR (RCI2 two-filter) (8)
【Mastering RCI!! Trend Reversal, Buy on Dips, Sell on Rallies】
Indicator that shines in combination with RCI【BODSOR・mBDSR】
and methods, case studies (PDF) ★GogoJungle AWARD2020 recipient★
https://www.gogojungle.co.jp/tools/indicators/11836
Pound New Zealand GBPNZD 5-minute chart
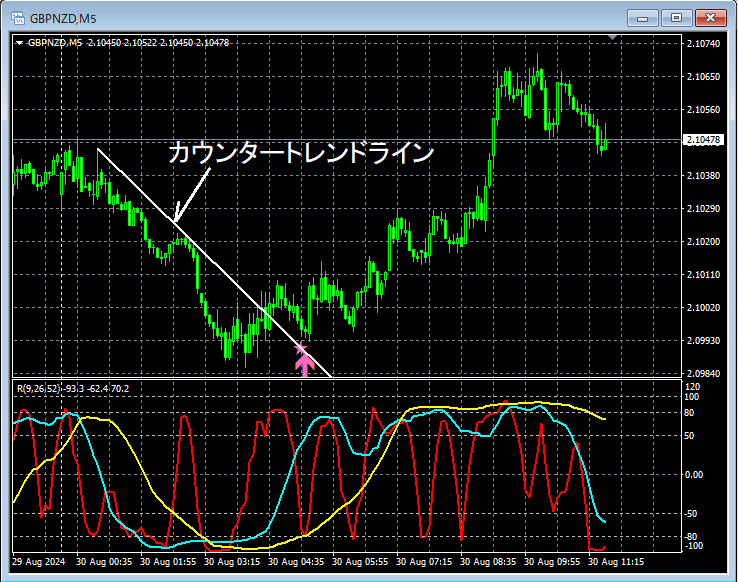
Details about the higher time frame are omitted. Also,Diving from higher time frame to lower time frame using RCIis described in detail in the accompanying PDF, so it is omitted here as well.
In actual trading, when formulating a plan,understanding the higher time frameanddiving from higher to lower time frames using RCIare extremely important.
On the 5-minute chart above,a counter-trend line breakoccurs. During the subsequent decline,the mBDSR (RCI two-filter) buy-the-dip signallights up and causes a strong rise.
※Please note that in the charts introduced in this article, for readability we may have added circles, lines, or boxes.
Indicator that shines in combination with RCI【BODSOR・mBDSR】
and methods, case studies (PDF) ★GogoJungle AWARD2020 recipient★
https://www.gogojungle.co.jp/tools/indicators/11836
The PDF file includes 358 documents (over 1,400 pages, over 470,000 characters in total).
Many of them areexamples that lay out how to logically link multiple higher-time-frame and lower-time-frame situations using the RCI three-line strategy, ultimately waiting for a dip buying or rally selling timing (the BDSR signal) on the lower time frameas a summarized approach.
Also,there are many sections focusing on identifying points where multiple entry reasons overlapas well.
Additionally,there are methods exploring ascent and descent targets using the RCI three-line strategyincluded.
In the explanations within the PDF file,more than 1,350 chartsare used.

Indicator that shines in combination with RCI【BODSOR・mBDSR】
and methods, case studies (PDF) ★GogoJungle AWARD2020 recipient★
https://www.gogojungle.co.jp/tools/indicators/11836
Pound New Zealand GBPNZD 5-minute chart
Details about the higher time frame are omitted. Also,Diving from higher time frame to lower time frame using RCIis described in detail in the accompanying PDF, so it is omitted here as well.
In actual trading, when formulating a plan,understanding the higher time frameanddiving from higher to lower time frames using RCIare extremely important.
On the 5-minute chart above,a counter-trend line breakoccurs. During the subsequent decline,the mBDSR (RCI two-filter) buy-the-dip signallights up and causes a strong rise.
※Please note that in the charts introduced in this article, for readability we may have added circles, lines, or boxes.
Indicator that shines in combination with RCI【BODSOR・mBDSR】
and methods, case studies (PDF) ★GogoJungle AWARD2020 recipient★
https://www.gogojungle.co.jp/tools/indicators/11836
The PDF file includes 358 documents (over 1,400 pages, over 470,000 characters in total).
Many of them areexamples that lay out how to logically link multiple higher-time-frame and lower-time-frame situations using the RCI three-line strategy, ultimately waiting for a dip buying or rally selling timing (the BDSR signal) on the lower time frameas a summarized approach.
Also,there are many sections focusing on identifying points where multiple entry reasons overlapas well.
Additionally,there are methods exploring ascent and descent targets using the RCI three-line strategyincluded.
In the explanations within the PDF file,more than 1,350 chartsare used.
× ![]()


