

Signals for the moving averages that are important, the double bottom, and mBDSR (RCI two-filter)
【Mastering RCI!! Trend Reversal, Buy on Dip, and Sell on Rally】
Indicator with powerful performance when combined with RCI: 【BODSOR・mBDSR】
and methods and case studies (PDF) ★GogoJungle AWARD2020 Winner★
https://www.gogojungle.co.jp/tools/indicators/11836
USD/JPY 5-minute chart
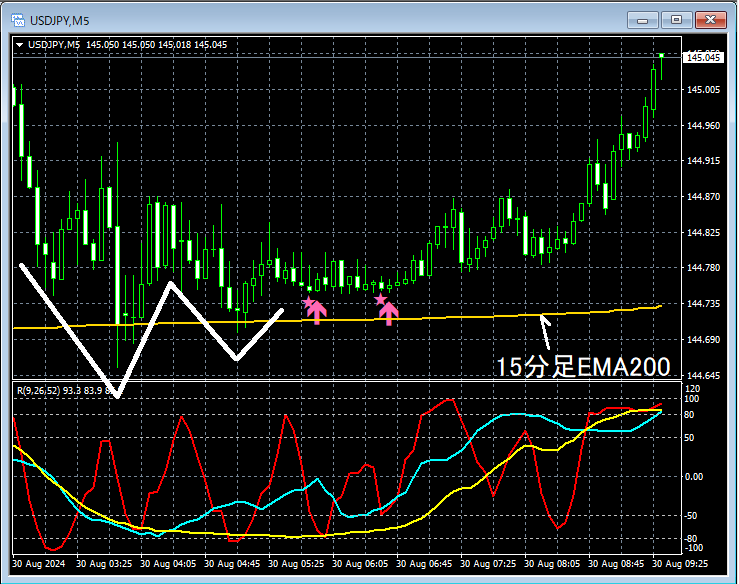
The state of the higher timeframe is omitted. On the above 5-minute chart, what is emphasizedis clearly the 200-period EMA on the 15-minute chartand it is unable to decisively break below, showing a rebound tendency.Double bottomis formed and rebounds,mBDSR (RCI two-line filter) buy-on-dip signalslight up twice and the price rises firmly.
From this example,a trading method that focuses on key moving averages and double bottomsandthe signals of mBDSRdemonstrates high compatibility.
※Please note that in the charts introduced in this article, for convenience of explanation, circles, lines, squares, etc. may be drawn.
Indicator with strong performance when combined with RCI: 【BODSOR・mBDSR】
and methods and case studies (PDF) ★GogoJungle AWARD2020 Winner★
https://www.gogojungle.co.jp/tools/indicators/11836
The PDF file includes 358 items (over 1,400 pages, over 470,000 characters in total).
Most of these areexamples that use three-line RCI to logically link higher and lower timeframes, sequentially analyze the conditions of multiple lower timeframes, and finally wait for the timing of pullbacks or rallies on the lower timeframe (i.e., mBDSR signals)..
In addition,many are focused on capturing points where multiple entry criteria overlap.Also included are methods to explore upside and downside targets using three-line RCI.
In the description of the PDF file,
more than 1,350 chartsare used.

Indicator with powerful performance when combined with RCI: 【BODSOR・mBDSR】
and methods and case studies (PDF) ★GogoJungle AWARD2020 Winner★
https://www.gogojungle.co.jp/tools/indicators/11836
USD/JPY 5-minute chart
The state of the higher timeframe is omitted. On the above 5-minute chart, what is emphasizedis clearly the 200-period EMA on the 15-minute chartand it is unable to decisively break below, showing a rebound tendency.Double bottomis formed and rebounds,mBDSR (RCI two-line filter) buy-on-dip signalslight up twice and the price rises firmly.
From this example,a trading method that focuses on key moving averages and double bottomsandthe signals of mBDSRdemonstrates high compatibility.
※Please note that in the charts introduced in this article, for convenience of explanation, circles, lines, squares, etc. may be drawn.
Indicator with strong performance when combined with RCI: 【BODSOR・mBDSR】
and methods and case studies (PDF) ★GogoJungle AWARD2020 Winner★
https://www.gogojungle.co.jp/tools/indicators/11836
The PDF file includes 358 items (over 1,400 pages, over 470,000 characters in total).
Most of these areexamples that use three-line RCI to logically link higher and lower timeframes, sequentially analyze the conditions of multiple lower timeframes, and finally wait for the timing of pullbacks or rallies on the lower timeframe (i.e., mBDSR signals)..
In addition,many are focused on capturing points where multiple entry criteria overlap.Also included are methods to explore upside and downside targets using three-line RCI.
In the description of the PDF file,
more than 1,350 chartsare used.
× ![]()


