

Sharp decline and Fibonacci retracement and the mBDSR (RCI two-filter) oversell signal
【Mastering RCI!! Trend Reversal, Buy on Dips, Sell on Rallies】
An indicator that shines in combination with RCI【BODSOR・mBDSR】
and techniques, case studies (PDF) ★GogoJungle AWARD2020 winner★
https://www.gogojungle.co.jp/tools/indicators/11836
Euro/British Pound Dollar - 30-minute chart
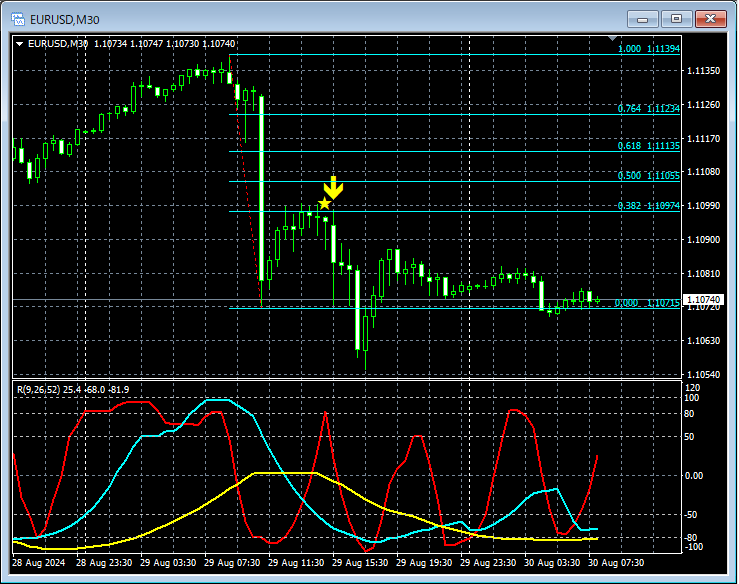
On the upper 30-minute chart, there was a rebound after a sharp drop.Fibonacci retracement 38.2% pullbackaround whichthe signal of mBDSR (RCI two-line filter)lights up, indicating another decline.
In the above example,mBDSR signalsare helpful for timing selling on rallies during a sharp drop.
From this example,a trade method focused on Fibonacci retracementandthe signals of mBDSRshow a high degree of compatibility.
※Please note that in the charts shown in this article, for easier explanation, circles, straight lines, squares, etc. may have been drawn.
An indicator that shines in combination with RCI【BODSOR・mBDSR】
and techniques, case studies (PDF) ★GogoJungle AWARD2020 winner★
https://www.gogojungle.co.jp/tools/indicators/11836
The PDF file is included with 358 files (over 1,400 pages, over 470,000 characters).
Many of them are compiled into examples that logically link higher and lower timeframes by using three RCI lines, examining multiple lower timeframes in sequence, and ultimately waiting for a dip buy or pullback sell timing (i.e., mBDSR signals) on the lower timeframe.
Additionally,many focus on capturing points where multiple entry reasons overlap.There are also many instances.
Furthermore,there are methods that explore upside and downside targets using three RCI lines.Also included.
In the explanations within the PDF files,more than 1,350 chartsare used.

An indicator that shines in combination with RCI【BODSOR・mBDSR】
and techniques, case studies (PDF) ★GogoJungle AWARD2020 winner★
https://www.gogojungle.co.jp/tools/indicators/11836
Euro/British Pound Dollar - 30-minute chart
On the upper 30-minute chart, there was a rebound after a sharp drop.Fibonacci retracement 38.2% pullbackaround whichthe signal of mBDSR (RCI two-line filter)lights up, indicating another decline.
In the above example,mBDSR signalsare helpful for timing selling on rallies during a sharp drop.
From this example,a trade method focused on Fibonacci retracementandthe signals of mBDSRshow a high degree of compatibility.
※Please note that in the charts shown in this article, for easier explanation, circles, straight lines, squares, etc. may have been drawn.
An indicator that shines in combination with RCI【BODSOR・mBDSR】
and techniques, case studies (PDF) ★GogoJungle AWARD2020 winner★
https://www.gogojungle.co.jp/tools/indicators/11836
The PDF file is included with 358 files (over 1,400 pages, over 470,000 characters).
Many of them are compiled into examples that logically link higher and lower timeframes by using three RCI lines, examining multiple lower timeframes in sequence, and ultimately waiting for a dip buy or pullback sell timing (i.e., mBDSR signals) on the lower timeframe.
Additionally,many focus on capturing points where multiple entry reasons overlap.There are also many instances.
Furthermore,there are methods that explore upside and downside targets using three RCI lines.Also included.
In the explanations within the PDF files,more than 1,350 chartsare used.
× ![]()


