

The importance of a top-down breakdown and the sign of mBDSR (RCI2 two-filter) (7)
0
Indicator that captures “tops/bottoms and reversals” when combined with RCI: 【mBDSR】
Methods and Case Studies (PDF) ★GogoJungle AWARD2020 Winner★
https://www.gogojungle.co.jp/tools/indicators/11836
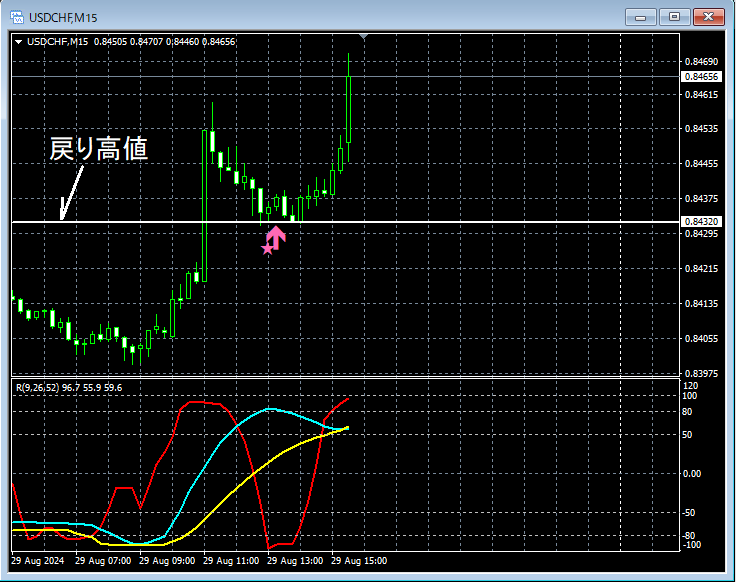
USD/CHF 15-minute chart
Details on the higher time frame are omitted. Also,Drilling down from higher time frames to lower time frames using RCIis explained in detail in the included PDF, so it is omitted here as well.
In actual trading, when planning a strategy,understanding the higher time frame situationanddrilling down from higher to lower time frames using RCIare extremely important.
On the upper 15-minute chart,the price retraced above the highthat was formed previously. After that,the retracement highnear that levelmBDSR (RCI two-filter) buy signallights up and the price rises sharply (so-calledsupport-turned-resistance reversal).
Note: In the charts presented in this article, for convenience, circles, lines, and squares may be added.
Indicator that shines when combined with RCI: 【BODSOR・mBDSR】
Methods and Case Studies (PDF) ★GogoJungle AWARD2020 Winner★
https://www.gogojungle.co.jp/tools/indicators/11836
The PDF file includes 358 items (over 1,400 pages, over 470,000 characters).
Many of these are designed to logically link higher and lower time frames using the RCI three-line, examining the multiple lower-time-frame conditions in sequence, and ultimately waiting for the lower-time-frame pullback buy or pullback sell timing (i.e., the mBDSR signal).
Additionally,there is a strong emphasis on identifying points where multiple entry reasons overlap..
Furthermore,there is also a method for exploring upside and downside targets using three RCI lines..
In the PDF explanations,more than 1,350 chartsare used.

Methods and Case Studies (PDF) ★GogoJungle AWARD2020 Winner★
https://www.gogojungle.co.jp/tools/indicators/11836
USD/CHF 15-minute chart
Details on the higher time frame are omitted. Also,Drilling down from higher time frames to lower time frames using RCIis explained in detail in the included PDF, so it is omitted here as well.
In actual trading, when planning a strategy,understanding the higher time frame situationanddrilling down from higher to lower time frames using RCIare extremely important.
On the upper 15-minute chart,the price retraced above the highthat was formed previously. After that,the retracement highnear that levelmBDSR (RCI two-filter) buy signallights up and the price rises sharply (so-calledsupport-turned-resistance reversal).
Note: In the charts presented in this article, for convenience, circles, lines, and squares may be added.
Indicator that shines when combined with RCI: 【BODSOR・mBDSR】
Methods and Case Studies (PDF) ★GogoJungle AWARD2020 Winner★
https://www.gogojungle.co.jp/tools/indicators/11836
The PDF file includes 358 items (over 1,400 pages, over 470,000 characters).
Many of these are designed to logically link higher and lower time frames using the RCI three-line, examining the multiple lower-time-frame conditions in sequence, and ultimately waiting for the lower-time-frame pullback buy or pullback sell timing (i.e., the mBDSR signal).
Additionally,there is a strong emphasis on identifying points where multiple entry reasons overlap..
Furthermore,there is also a method for exploring upside and downside targets using three RCI lines..
In the PDF explanations,more than 1,350 chartsare used.
× ![]()


