

Important moving average line being watched and the pullback high and the mBDSR (RCI two-filter) short signal
【Mastering RCI!! Trend Reversal, Buy on Dips, Sell on Rallies】
An indicator that shines in combination with RCI: 【BODSOR・mBDSR】
Methods, case studies (PDF) ★GogoJungle AWARD2020 winner★
https://www.gogojungle.co.jp/tools/indicators/11836
USD/CAD 30-minute chart
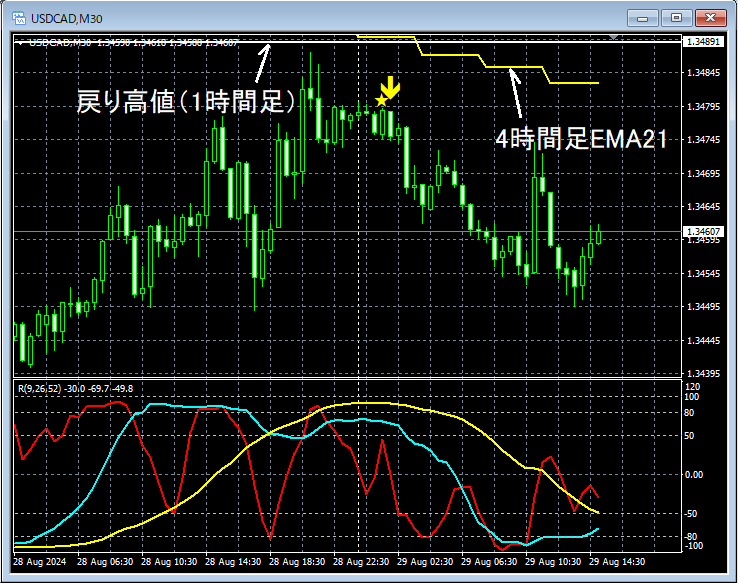
The higher-timeframe context is omitted.
1-hour return highsand4-hour EMA21overlap and price reverses from there.mBDSR (two RCI lines filter) sell signallights up, indicating price is steadily moving lower.
From this example,a trading method focusing on return highs (Dow Theory) and moving averagesandthe synergy with mBDSR signalsis evident.
※Please note that in the charts referenced in this article, for convenience of explanation, circles, lines, and rectangles may have been added.
An indicator that shines in combination with RCI: 【BODSOR・mBDSR】
Methods, case studies (PDF) ★GogoJungle AWARD2020 winner★
https://www.gogojungle.co.jp/tools/indicators/11836
The PDF includes 358 files (over 1,400 pages, over 470,000 characters).
Many of these are...summaries of cases where three RCI lines logically link higher and lower timeframes, sequentially considering multiple lower-timeframe conditions, and ultimately waiting for the dip-buy or pullback signal on the lower timeframe (i.e., the mBDSR signal).This is the gist.
Additionally,there is a focus on capturing points where multiple entry reasons coincide.Many examples follow this approach.
Furthermore,there are methods for exploring upward and downward targets using three RCI lines.as well.
In the PDF descriptions,over 1,350 chartsare used.

An indicator that shines in combination with RCI: 【BODSOR・mBDSR】
Methods, case studies (PDF) ★GogoJungle AWARD2020 winner★
https://www.gogojungle.co.jp/tools/indicators/11836
USD/CAD 30-minute chart
The higher-timeframe context is omitted.
1-hour return highsand4-hour EMA21overlap and price reverses from there.mBDSR (two RCI lines filter) sell signallights up, indicating price is steadily moving lower.
From this example,a trading method focusing on return highs (Dow Theory) and moving averagesandthe synergy with mBDSR signalsis evident.
※Please note that in the charts referenced in this article, for convenience of explanation, circles, lines, and rectangles may have been added.
An indicator that shines in combination with RCI: 【BODSOR・mBDSR】
Methods, case studies (PDF) ★GogoJungle AWARD2020 winner★
https://www.gogojungle.co.jp/tools/indicators/11836
The PDF includes 358 files (over 1,400 pages, over 470,000 characters).
Many of these are...summaries of cases where three RCI lines logically link higher and lower timeframes, sequentially considering multiple lower-timeframe conditions, and ultimately waiting for the dip-buy or pullback signal on the lower timeframe (i.e., the mBDSR signal).This is the gist.
Additionally,there is a focus on capturing points where multiple entry reasons coincide.Many examples follow this approach.
Furthermore,there are methods for exploring upward and downward targets using three RCI lines.as well.
In the PDF descriptions,over 1,350 chartsare used.
× ![]()


