

Importance of narrowing down from higher timeframe to lower timeframe and the signal of mBDSR (RCI2 two-filter) (6)
0
【Mastering RCI!! Trend Reversal, Buy the Dip, Sell the Rebound】
Indicator【BODSOR・mBDSR】that shines when combined with RCI
Methods・Case Studies (PDF) ★GogoJungle AWARD2020 Winner★
https://www.gogojungle.co.jp/tools/indicators/11836
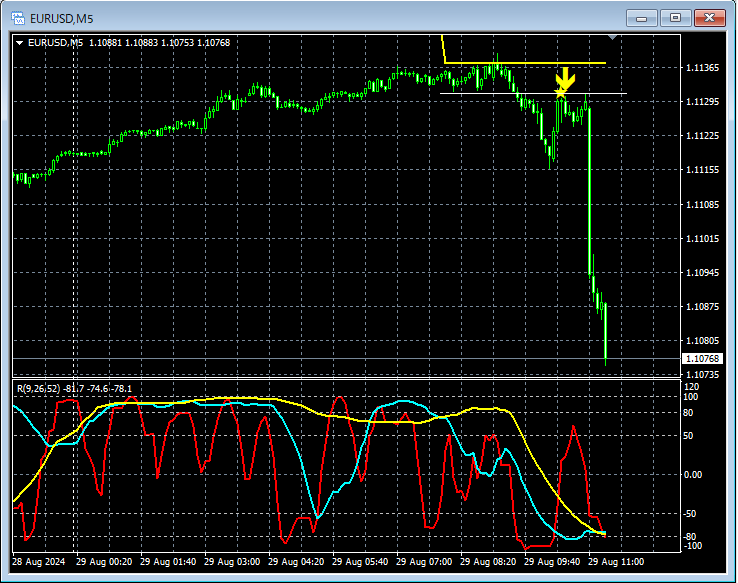
EURUSD 5-minute chart
Details about the higher timeframe are omitted. Also,Drill-down from higher timeframe to lower timeframe using RCIis explained in detail in the included PDF, so it is omitted here as well.
In actual trading, when planning the strategy,understanding the higher timeframeanddrill-down from higher timeframe to lower timeframe using RCIare extremely important.
On the above 5-minute chart,near the 4-hour EMA21 (an important moving average)the price reverses. Furthermoresupport lineis broken below. After that, the price rises again toward thesupport linemBDSR (two-filter RCI) sell signallights up and the price drops sharply (the so-calledsupport-resistance flip).
※In the charts shown in this article, for convenience of explanation, circles, straight lines, and rectangles may be drawn, so please be aware.
Indicator【BODSOR・mBDSR】that shines when combined with RCI
Methods・Case Studies (PDF) ★GogoJungle AWARD2020 Winner★
https://www.gogojungle.co.jp/tools/indicators/11836
The PDF file includes 358 files (over 1,400 pages, over 470,000 characters in total).
Most of them areexamples that break down a process of logically linking higher and lower timeframes using the three RCI lines, and ultimately waiting for pullbacks or pullback timing (the mBDSR signal) on the lower timeframes.
Also,many focus on identifying points where multiple entry reasons overlapas well.
Furthermore,it includes methods to explore upward and downward targets using three RCI lines.
In the PDF explanations,more than 1,350 chartsare used.

Indicator【BODSOR・mBDSR】that shines when combined with RCI
Methods・Case Studies (PDF) ★GogoJungle AWARD2020 Winner★
https://www.gogojungle.co.jp/tools/indicators/11836
EURUSD 5-minute chart
Details about the higher timeframe are omitted. Also,Drill-down from higher timeframe to lower timeframe using RCIis explained in detail in the included PDF, so it is omitted here as well.
In actual trading, when planning the strategy,understanding the higher timeframeanddrill-down from higher timeframe to lower timeframe using RCIare extremely important.
On the above 5-minute chart,near the 4-hour EMA21 (an important moving average)the price reverses. Furthermoresupport lineis broken below. After that, the price rises again toward thesupport linemBDSR (two-filter RCI) sell signallights up and the price drops sharply (the so-calledsupport-resistance flip).
※In the charts shown in this article, for convenience of explanation, circles, straight lines, and rectangles may be drawn, so please be aware.
Indicator【BODSOR・mBDSR】that shines when combined with RCI
Methods・Case Studies (PDF) ★GogoJungle AWARD2020 Winner★
https://www.gogojungle.co.jp/tools/indicators/11836
The PDF file includes 358 files (over 1,400 pages, over 470,000 characters in total).
Most of them areexamples that break down a process of logically linking higher and lower timeframes using the three RCI lines, and ultimately waiting for pullbacks or pullback timing (the mBDSR signal) on the lower timeframes.
Also,many focus on identifying points where multiple entry reasons overlapas well.
Furthermore,it includes methods to explore upward and downward targets using three RCI lines.
In the PDF explanations,more than 1,350 chartsare used.
× ![]()


