

The importance of translating from higher time frame to lower time frame and the signal of mBDSR (RCI 2-filter) (5)
0
Indicator that delivers power in combination with RCI: 【BODSOR・mBDSR】
Methods and Case Studies (PDF) ★GogoJungle AWARD 2020 winner★
https://www.gogojungle.co.jp/tools/indicators/11836
NZDCAD 5-minute chart
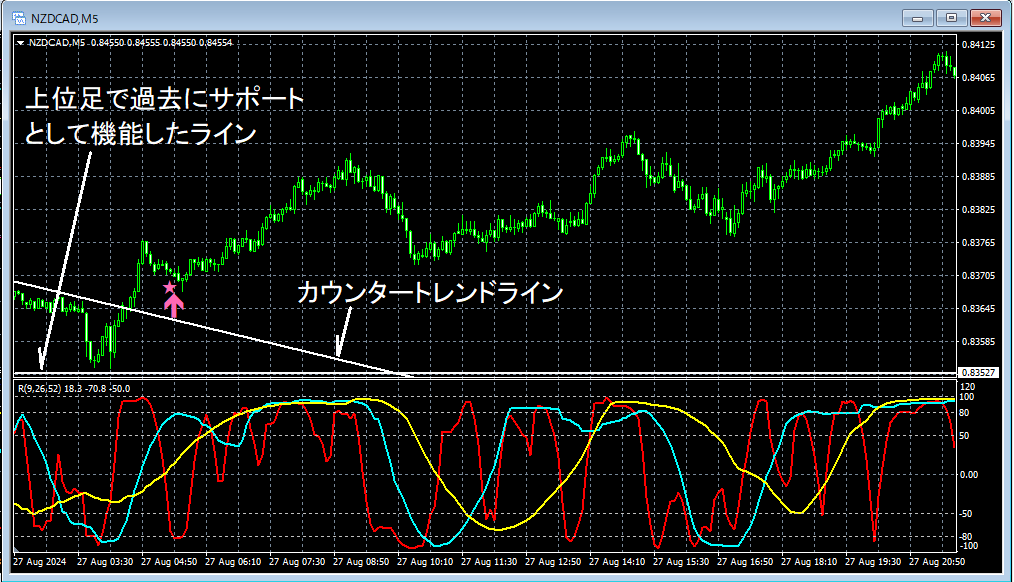
The status of the higher timeframes is omitted. Also,drilling down from higher timeframes to lower timeframes using RCIis described in detail in the accompanying PDF, so it is omitted here as well.
In actual trading, when formulating a plan,understanding the higher timeframe situationanddrilling down from higher to lower timeframes using RCIare extremely important.
On the above 5-minute chart,the price rebounded from a line that previously acted as supportnearby. Furthermore,broke above the counter-trend line. In the subsequent decline,the mBDSR (RCI two-lines filter) pullback buy signallit up and surged significantly.
※ Please note that in the charts presented in this article, for convenience of explanation, circles, straight lines, squares, etc. may be added.
Indicator that delivers power in combination with RCI: 【BODSOR・mBDSR】
Methods and Case Studies (PDF) ★GogoJungle AWARD 2020 winner★
https://www.gogojungle.co.jp/tools/indicators/11836
The PDF file includes 358 pieces (over 1,400 pages, over 470,000 characters in total).
Many of them areexamples that lay out how, by linking the higher and lower timeframes logically using the three-line RCI, one can sequentially consider the status of multiple lower timeframes and ultimately wait for pullback buying or pullback selling signals on the lower timeframe (i.e., the mBDSR signal)..
Additionally,many focus on identifying points where multiple entry signals converge..
Furthermore,there are also methods to explore upward and downward targets using the three-line RCI..
In the explanations within the PDF file,more than 1,350 chartsare used.

Methods and Case Studies (PDF) ★GogoJungle AWARD 2020 winner★
https://www.gogojungle.co.jp/tools/indicators/11836
NZDCAD 5-minute chart
The status of the higher timeframes is omitted. Also,drilling down from higher timeframes to lower timeframes using RCIis described in detail in the accompanying PDF, so it is omitted here as well.
In actual trading, when formulating a plan,understanding the higher timeframe situationanddrilling down from higher to lower timeframes using RCIare extremely important.
On the above 5-minute chart,the price rebounded from a line that previously acted as supportnearby. Furthermore,broke above the counter-trend line. In the subsequent decline,the mBDSR (RCI two-lines filter) pullback buy signallit up and surged significantly.
※ Please note that in the charts presented in this article, for convenience of explanation, circles, straight lines, squares, etc. may be added.
Indicator that delivers power in combination with RCI: 【BODSOR・mBDSR】
Methods and Case Studies (PDF) ★GogoJungle AWARD 2020 winner★
https://www.gogojungle.co.jp/tools/indicators/11836
The PDF file includes 358 pieces (over 1,400 pages, over 470,000 characters in total).
Many of them areexamples that lay out how, by linking the higher and lower timeframes logically using the three-line RCI, one can sequentially consider the status of multiple lower timeframes and ultimately wait for pullback buying or pullback selling signals on the lower timeframe (i.e., the mBDSR signal)..
Additionally,many focus on identifying points where multiple entry signals converge..
Furthermore,there are also methods to explore upward and downward targets using the three-line RCI..
In the explanations within the PDF file,more than 1,350 chartsare used.
× ![]()


