

[Good Risk-Reward Trade] Buy-the-dip signal with prominent high, moving average, and mBDSR (RCI two-line filter)
0
Indicator that shines when used with RCI: 【BODSOR・mBDSR】
Method and case study (PDF) ★GogoJungle AWARD2020 winner★
https://www.gogojungle.co.jp/tools/indicators/11836
Swiss Franc to Japanese Yen CHFJPY 15-minute chart
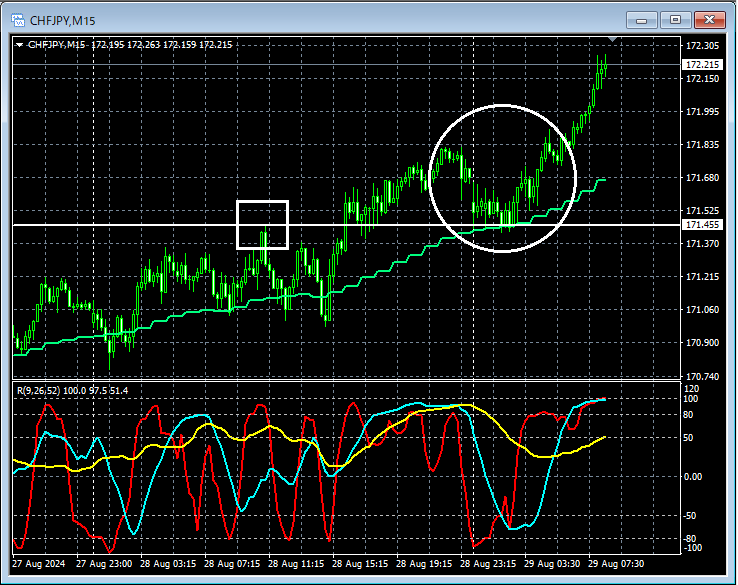
Looking at the area circled in white on the 15-minute chart above, it seems to be a key area1-hour EMA21anda line indicating notable highsoverlap, which might present a scene where a pullback could be considered a buying opportunity. We will look for signs of upward movement on lower timeframes.
Swiss Franc to Japanese Yen CHFJPY 5-minute chart
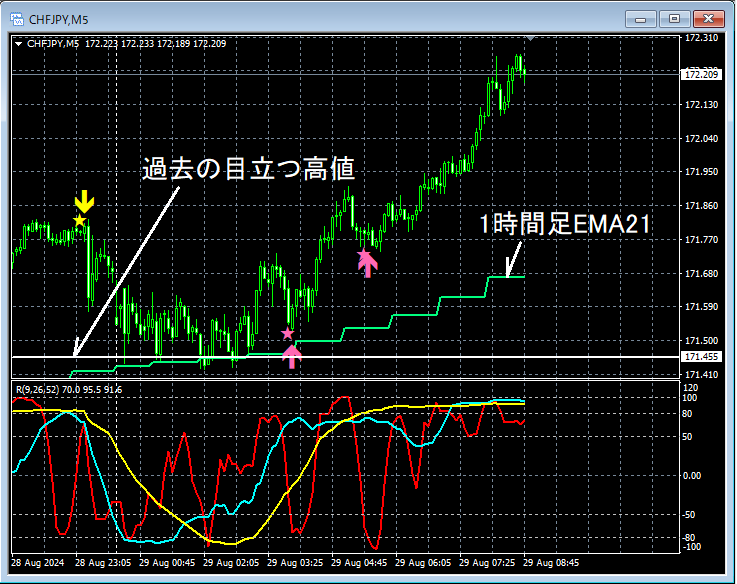
On the 5-minute chart above,1-hour EMA21anda line indicating notable past highsoverlap,mBDSR (RCI two-line filter) pullback buy signallights up, and price rises sharply immediately after.
From this example,a trading method focusing on rebounds at moving averages and support areas (Dow Theory)andthe signals of mBDSRshow a high degree of harmony.
Additionally, in this example, placing the stop loss slightly below the recent lowwitha favorable risk-reward ratiois possible for a good trade.
※In the charts introduced in this article, for convenience of explanation, circles, lines, and rectangles may be drawn.
Indicator that shines when used with RCI: 【BODSOR・mBDSR】
Method and case study (PDF) ★GogoJungle AWARD2020 winner★
https://www.gogojungle.co.jp/tools/indicators/11836
The PDF file contains 358 items (over 1,400 pages, over 470,000 words).
Many of them are summaries of examples that break down multiple lower-timeframe conditions by logically linking the upper and lower timeframes using three RCI lines, ultimately waiting for pullbacks on lower timeframes or selling into a retracement (i.e., mBDSR signals).
Also,many of them emphasize capturing points where multiple entry reasons overlap..
In addition,there are methods that explore rise and fall targets using three RCI lines..
In the PDFs,over 1,350 chartsare used.

Method and case study (PDF) ★GogoJungle AWARD2020 winner★
https://www.gogojungle.co.jp/tools/indicators/11836
Swiss Franc to Japanese Yen CHFJPY 15-minute chart
Looking at the area circled in white on the 15-minute chart above, it seems to be a key area1-hour EMA21anda line indicating notable highsoverlap, which might present a scene where a pullback could be considered a buying opportunity. We will look for signs of upward movement on lower timeframes.
Swiss Franc to Japanese Yen CHFJPY 5-minute chart
On the 5-minute chart above,1-hour EMA21anda line indicating notable past highsoverlap,mBDSR (RCI two-line filter) pullback buy signallights up, and price rises sharply immediately after.
From this example,a trading method focusing on rebounds at moving averages and support areas (Dow Theory)andthe signals of mBDSRshow a high degree of harmony.
Additionally, in this example, placing the stop loss slightly below the recent lowwitha favorable risk-reward ratiois possible for a good trade.
※In the charts introduced in this article, for convenience of explanation, circles, lines, and rectangles may be drawn.
Indicator that shines when used with RCI: 【BODSOR・mBDSR】
Method and case study (PDF) ★GogoJungle AWARD2020 winner★
https://www.gogojungle.co.jp/tools/indicators/11836
The PDF file contains 358 items (over 1,400 pages, over 470,000 words).
Many of them are summaries of examples that break down multiple lower-timeframe conditions by logically linking the upper and lower timeframes using three RCI lines, ultimately waiting for pullbacks on lower timeframes or selling into a retracement (i.e., mBDSR signals).
Also,many of them emphasize capturing points where multiple entry reasons overlap..
In addition,there are methods that explore rise and fall targets using three RCI lines..
In the PDFs,over 1,350 chartsare used.
× ![]()


