

[Targeting the 3rd Wave!!] Elliott Wave, Moving Averages, and mBDSR (RCI two-filter) Rebound Sell Signal
0
Indicator that shines when combined with RCI【BODSOR・mBDSR】
Methods and Case Studies (PDF) ★GogoJungle AWARD2020 Winner★
https://www.gogojungle.co.jp/tools/indicators/11836
Pound/Swiss CHFGBP 15-minute chart
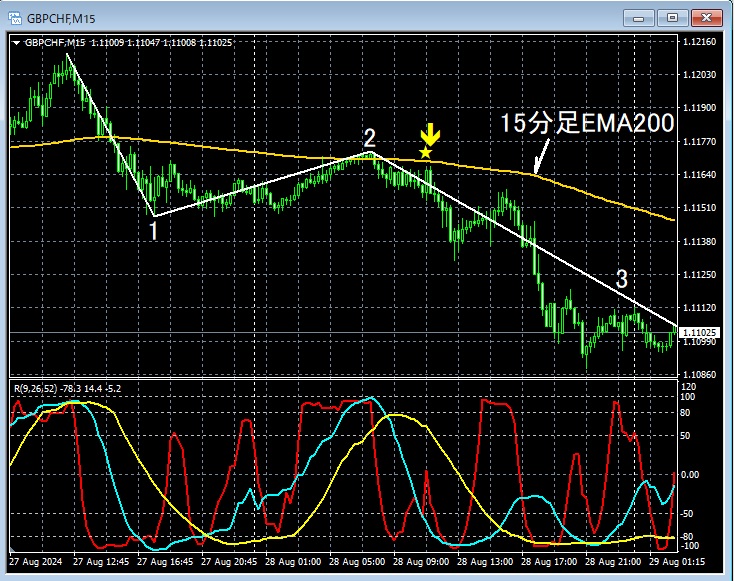
The 15-minute chart above showsthe Elliott Wave of the 5-minute chart.15-minute EMA200fell below, and near the moving average themBDSR (RCI two-lines filter) sell signalturned on and it clearly moved downward.Early movement of the 3rd wave in the declineis being captured effectively.
From this example,a trading method focusing on Elliott Wave and moving averagesandthe signals of mBDSRshow a high degree of compatibility.
Additionally, in this example, placing the stop loss slightly above the recent highallows for favorable risk-reward trades.with a good risk-reward profile..
※Please note that in this article's charts, for convenience of explanation, circles, lines, and rectangles may have been added.
Indicator that shines when combined with RCI【BODSOR・mBDSR】
Methods and Case Studies (PDF) ★GogoJungle AWARD2020 Winner★
https://www.gogojungle.co.jp/tools/indicators/11836
The PDF file includes 358 files (over 1,400 pages, over 470,000 characters).
Many of thesedocument how, by using the 3-line RCI, linking higher and lower timeframes logically, various lower-timeframe conditions are sequentially examined, and ultimately waiting for a buying opportunity on pullbacks or selling on rallies (i.e., mBDSR signals) on the lower timeframes.
Furthermore,many focus on identifying points where multiple entry reasons overlap.
Additionally,there is also content exploring recovery paths and downside targets using the 3-line RCI.
In the PDF's explanations,more than 1,350 chartsare used.

Methods and Case Studies (PDF) ★GogoJungle AWARD2020 Winner★
https://www.gogojungle.co.jp/tools/indicators/11836
Pound/Swiss CHFGBP 15-minute chart
The 15-minute chart above showsthe Elliott Wave of the 5-minute chart.15-minute EMA200fell below, and near the moving average themBDSR (RCI two-lines filter) sell signalturned on and it clearly moved downward.Early movement of the 3rd wave in the declineis being captured effectively.
From this example,a trading method focusing on Elliott Wave and moving averagesandthe signals of mBDSRshow a high degree of compatibility.
Additionally, in this example, placing the stop loss slightly above the recent highallows for favorable risk-reward trades.with a good risk-reward profile..
※Please note that in this article's charts, for convenience of explanation, circles, lines, and rectangles may have been added.
Indicator that shines when combined with RCI【BODSOR・mBDSR】
Methods and Case Studies (PDF) ★GogoJungle AWARD2020 Winner★
https://www.gogojungle.co.jp/tools/indicators/11836
The PDF file includes 358 files (over 1,400 pages, over 470,000 characters).
Many of thesedocument how, by using the 3-line RCI, linking higher and lower timeframes logically, various lower-timeframe conditions are sequentially examined, and ultimately waiting for a buying opportunity on pullbacks or selling on rallies (i.e., mBDSR signals) on the lower timeframes.
Furthermore,many focus on identifying points where multiple entry reasons overlap.
Additionally,there is also content exploring recovery paths and downside targets using the 3-line RCI.
In the PDF's explanations,more than 1,350 chartsare used.
× ![]()


