

Recognized moving average, double top, and the return-sell signal of mBDSR (RCI two-filter)
0
Indicator that shines in combination with RCI【BODSOR・mBDSR】
Methods, cases study (PDF) ★GogoJungle AWARD2020 Winner★
https://www.gogojungle.co.jp/tools/indicators/11836
GBP/CHF 4-hour chart
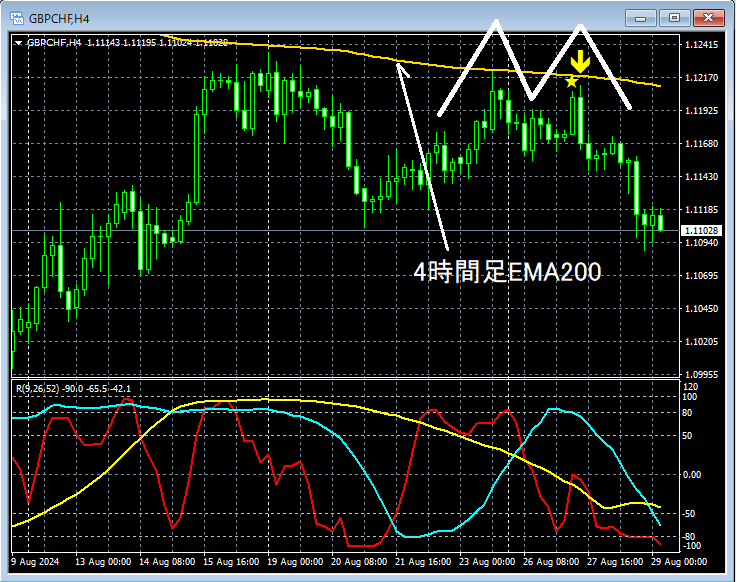
On the 4-hour chart above, it has previously acted as support4-hour EMA200As it rose toward this areaDouble topand then declined. Thedouble top’s right peakmBDSR (RCI two-filter) selling signallights up as a selling signal.
From this example,a method focusing on moving averages and double tops that a chart pays attention toandthe signal of mBDSRshow high compatibility.
※ Please note that charts introduced in this article may have drawings such as circles, straight lines, and rectangles added for convenience of explanation.
Indicator that shines in combination with RCI【BODSOR・mBDSR】
Methods, cases study (PDF) ★GogoJungle AWARD2020 Winner★
https://www.gogojungle.co.jp/tools/indicators/11836
The PDF file includes 358 items (over 1,400 pages, over 470,000 characters).
Most of them are compiled as examples that logically link higher and lower time frames using three RCI lines, examining multiple lower-time-frame situations step by step, and ultimately waiting for entry timing on the lower time frame (i.e., mBDSR signals) for a pullback buy or a pullback sale.
In addition,many focus on identifying points where multiple entry reasons align.There are also many that explore upward and downward targets using the three-RCI-line technique.
Moreover,the technique to explore upside and downside targets using three RCI lines is also included..
In the PDF explanations,more than 1,350 chartsare used.

Methods, cases study (PDF) ★GogoJungle AWARD2020 Winner★
https://www.gogojungle.co.jp/tools/indicators/11836
GBP/CHF 4-hour chart
On the 4-hour chart above, it has previously acted as support4-hour EMA200As it rose toward this areaDouble topand then declined. Thedouble top’s right peakmBDSR (RCI two-filter) selling signallights up as a selling signal.
From this example,a method focusing on moving averages and double tops that a chart pays attention toandthe signal of mBDSRshow high compatibility.
※ Please note that charts introduced in this article may have drawings such as circles, straight lines, and rectangles added for convenience of explanation.
Indicator that shines in combination with RCI【BODSOR・mBDSR】
Methods, cases study (PDF) ★GogoJungle AWARD2020 Winner★
https://www.gogojungle.co.jp/tools/indicators/11836
The PDF file includes 358 items (over 1,400 pages, over 470,000 characters).
Most of them are compiled as examples that logically link higher and lower time frames using three RCI lines, examining multiple lower-time-frame situations step by step, and ultimately waiting for entry timing on the lower time frame (i.e., mBDSR signals) for a pullback buy or a pullback sale.
In addition,many focus on identifying points where multiple entry reasons align.There are also many that explore upward and downward targets using the three-RCI-line technique.
Moreover,the technique to explore upside and downside targets using three RCI lines is also included..
In the PDF explanations,more than 1,350 chartsare used.
× ![]()


