

Previous high on higher timeframe, 2-bar reversal, and in lower timeframe a pin bar and mBDSR short signal
0
Indicator that shines in combination with RCI: BODSOR・mBDSR
Methods and Case Studies (PDF) ★GogoJungle AWARD 2020 Winner★
https://www.gogojungle.co.jp/tools/indicators/11836
Pound/NZD GBP-NZD Weekly
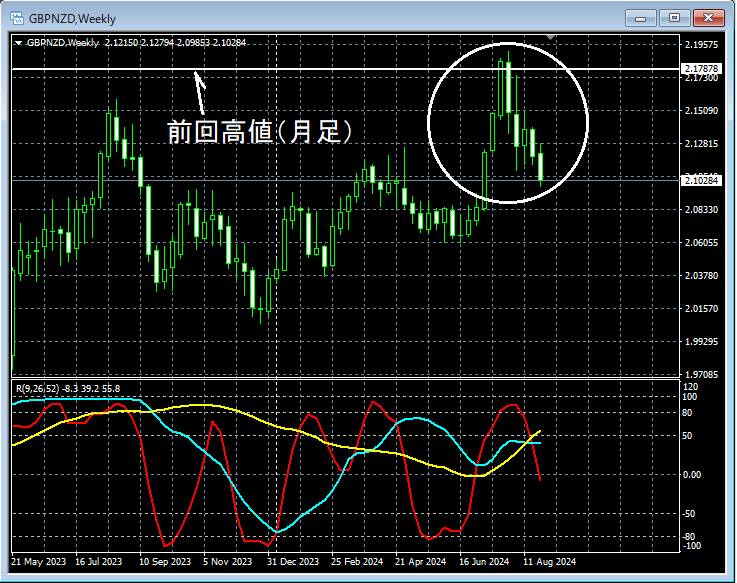
If you look at the area circled in white on the weekly chart above,the previous high on the monthly levelis approached and then signals a decline2-bar reversalhas appeared, so it may not be strange to consider selling on pullbacks on the lower timeframes. In this case,2-bar reversalis a pattern where traders who rode a strong rise get caught. Public sentiment is interpreted as turning downward (bearish).
Pound/NZD GBP-NZD Daily
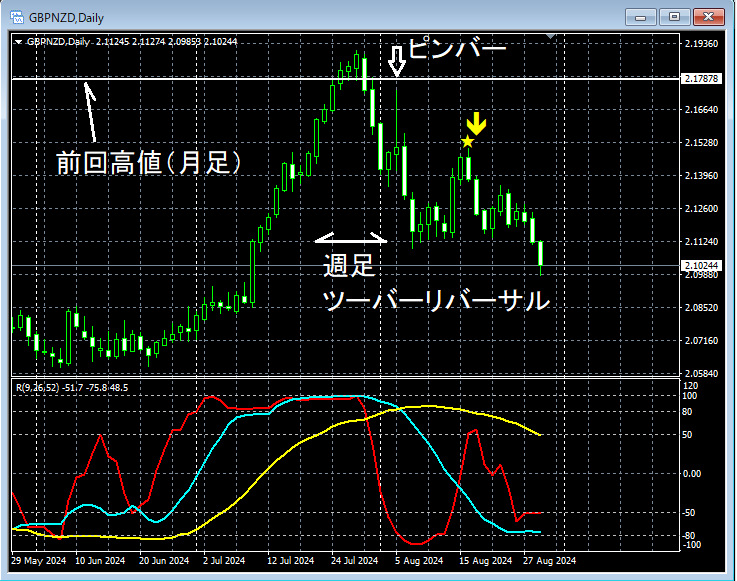
On the daily chart, following the2-bar reversalthat appeared on the weekly chart, after a decline and then a rise, apin bar (long upper shadow)appears indicating a potential decline. Then,the return-sell signal of mBDSR (RCI two-filter)lights up and the price continues to fall.
From this example,a trading method focusing on previous highs, 2-bar reversals, and pin barsandthe signals of mBDSRshow a strong synergy.
※Please note that in the charts introduced in this article, circles, straight lines, squares, etc. may be added for convenience of explanation.
Indicator that shines in combination with RCI: BODSOR・mBDSR
Methods and Case Studies (PDF) ★GogoJungle AWARD 2020 Winner★
https://www.gogojungle.co.jp/tools/indicators/11836
The PDF file includes 358 items (over 1,400 pages, over 470,000 characters in total).
Most of them aresummaries of examples that link higher and lower timeframes logically using the RCI three-line method, then break down into examining multiple lower-timeframe conditions step by step, ultimately waiting for pullbacks or entry on lower timeframes (= mBDSR signals)..
Also,many emphasize locating points where multiple entry reasons overlap.
In addition,there is also a method to explore rising and falling targets using three RCI lines..
In the PDF explanations,more than 1,350 chartsare used.

Methods and Case Studies (PDF) ★GogoJungle AWARD 2020 Winner★
https://www.gogojungle.co.jp/tools/indicators/11836
Pound/NZD GBP-NZD Weekly
If you look at the area circled in white on the weekly chart above,the previous high on the monthly levelis approached and then signals a decline2-bar reversalhas appeared, so it may not be strange to consider selling on pullbacks on the lower timeframes. In this case,2-bar reversalis a pattern where traders who rode a strong rise get caught. Public sentiment is interpreted as turning downward (bearish).
Pound/NZD GBP-NZD Daily
On the daily chart, following the2-bar reversalthat appeared on the weekly chart, after a decline and then a rise, apin bar (long upper shadow)appears indicating a potential decline. Then,the return-sell signal of mBDSR (RCI two-filter)lights up and the price continues to fall.
From this example,a trading method focusing on previous highs, 2-bar reversals, and pin barsandthe signals of mBDSRshow a strong synergy.
※Please note that in the charts introduced in this article, circles, straight lines, squares, etc. may be added for convenience of explanation.
Indicator that shines in combination with RCI: BODSOR・mBDSR
Methods and Case Studies (PDF) ★GogoJungle AWARD 2020 Winner★
https://www.gogojungle.co.jp/tools/indicators/11836
The PDF file includes 358 items (over 1,400 pages, over 470,000 characters in total).
Most of them aresummaries of examples that link higher and lower timeframes logically using the RCI three-line method, then break down into examining multiple lower-timeframe conditions step by step, ultimately waiting for pullbacks or entry on lower timeframes (= mBDSR signals)..
Also,many emphasize locating points where multiple entry reasons overlap.
In addition,there is also a method to explore rising and falling targets using three RCI lines..
In the PDF explanations,more than 1,350 chartsare used.
× ![]()


