

[Multiple Entry Basis] Buy signal on pullback combining Counter Trend Line, Moving Average, and mBDSR (RCI two-filter)
0
Indicator that shines in combination with RCI: BODSOR/mBDSR
methods and case studies (PDF) ★GogoJungle AWARD 2020 Winner★
https://www.gogojungle.co.jp/tools/indicators/11836
Kiwi Dollar NZDUSD 30-minute chart
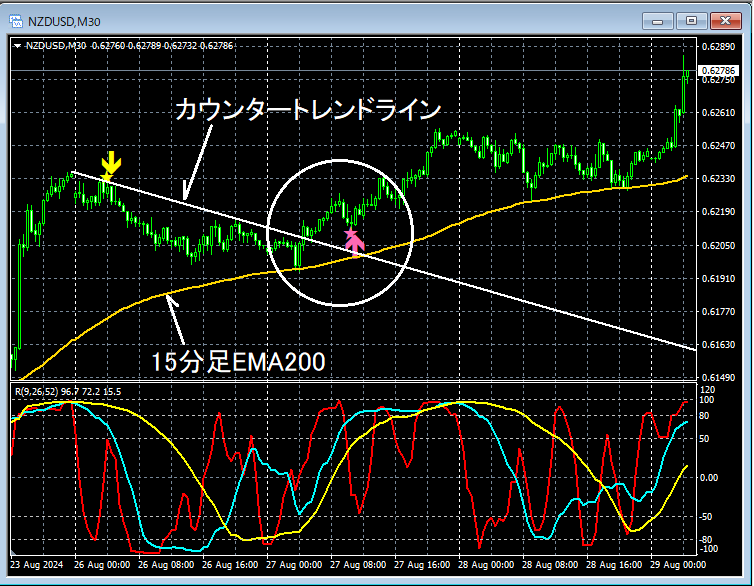
Regarding the higher time frame, omitted. On the 30-minute chart above,the 15-minute EMA200rebounded near andbroke above the counter-trend lineand during the subsequent declinemBDSR (RCI two-lines filter) breakout signallights up and the price rises sharply.
Rebounds near key moving averagesandbreak above counter-trend lineandactivation of mBDSR breakout signaloverlap as multiple entry grounds, suggesting a confluence.
From this example,a trading approach focused on moving averages and counter-trend linesandsignals from mBDSRshow high compatibility.
Note: In this article's charts, for convenience of explanation, circles, lines, and boxes may be added; please understand.
Indicator that shines in combination with RCI: BODSOR/mBDSR
methods and case studies (PDF) ★GogoJungle AWARD 2020 Winner★
https://www.gogojungle.co.jp/tools/indicators/11836
The PDF file includes 358 items (over 1,400 pages, over 470,000 characters).
Most of them are summaries of examples that logically link higher and lower time frames using three RCI lines, sequentially examining the status of multiple lower time frames, and ultimately waiting for the timing of pullbacks on lower time frames (i.e., the mBDSR signal).
Also,many focus on capturing points where multiple entry grounds overlap.There are also many examples.
Additionally,there are methods for exploring upward and downward targets using three RCI lines..
In the PDF's explanations,more than 1,350 chartsare used.

methods and case studies (PDF) ★GogoJungle AWARD 2020 Winner★
https://www.gogojungle.co.jp/tools/indicators/11836
Kiwi Dollar NZDUSD 30-minute chart
Regarding the higher time frame, omitted. On the 30-minute chart above,the 15-minute EMA200rebounded near andbroke above the counter-trend lineand during the subsequent declinemBDSR (RCI two-lines filter) breakout signallights up and the price rises sharply.
Rebounds near key moving averagesandbreak above counter-trend lineandactivation of mBDSR breakout signaloverlap as multiple entry grounds, suggesting a confluence.
From this example,a trading approach focused on moving averages and counter-trend linesandsignals from mBDSRshow high compatibility.
Note: In this article's charts, for convenience of explanation, circles, lines, and boxes may be added; please understand.
Indicator that shines in combination with RCI: BODSOR/mBDSR
methods and case studies (PDF) ★GogoJungle AWARD 2020 Winner★
https://www.gogojungle.co.jp/tools/indicators/11836
The PDF file includes 358 items (over 1,400 pages, over 470,000 characters).
Most of them are summaries of examples that logically link higher and lower time frames using three RCI lines, sequentially examining the status of multiple lower time frames, and ultimately waiting for the timing of pullbacks on lower time frames (i.e., the mBDSR signal).
Also,many focus on capturing points where multiple entry grounds overlap.There are also many examples.
Additionally,there are methods for exploring upward and downward targets using three RCI lines..
In the PDF's explanations,more than 1,350 chartsare used.
× ![]()


