

[Gold Strategy] Reversal Sell Signals: Pin Bar on Higher Time Frame and mBDSR on Lower Time Frame
Indicator that shows power when paired with RCI【BODSOR・mBDSR】
Methods and Case Studies (PDF) ★GogoJungle AWARD2020 Winner★
https://www.gogojungle.co.jp/tools/indicators/11836
Gold XAUUSD 1-Hour
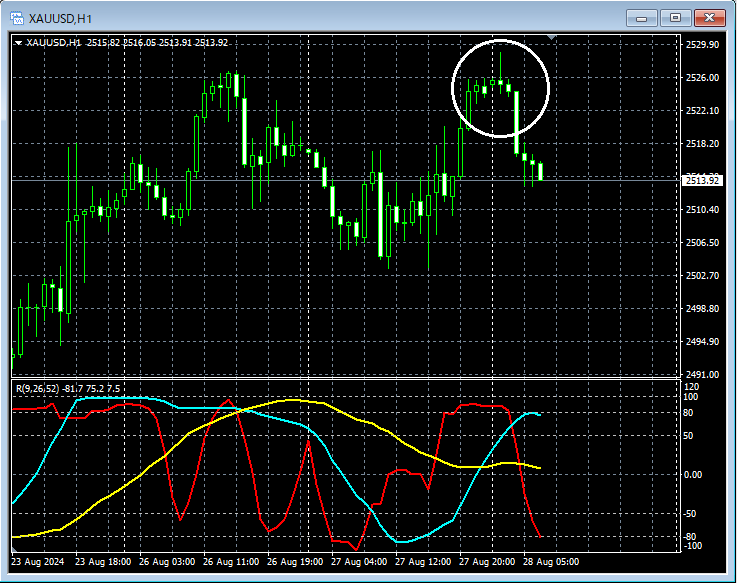
Looking at the area circled in white on the 1-hour chart above suggests a potential declinePin Bar (long upper wick candle) has appeared, and it may not be unusual to consider selling on lower timeframes. In this case, thePin Bar is a pattern where traders who jumped in during a strong rise get caught. The crowd’s sentiment may be interpreted as bearish.
Gold XAUUSD 5-Minute
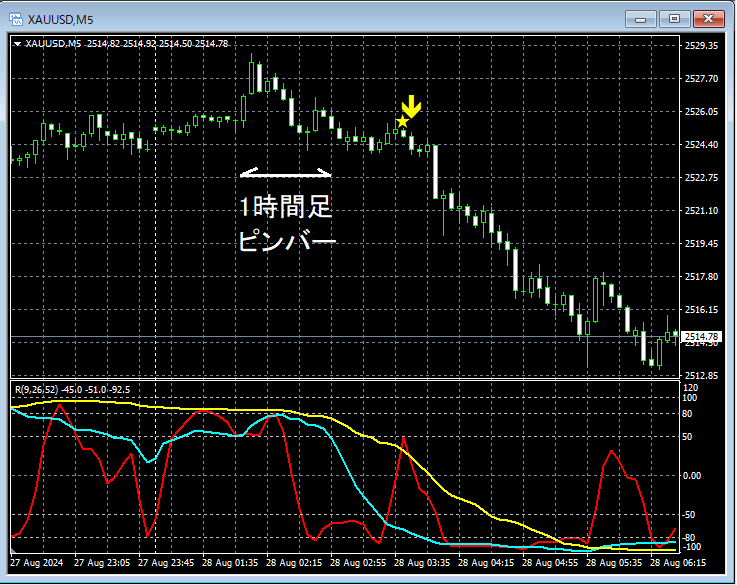
On the 5-minute chart above, after the Pin Bar (long upper wick) appeared on the 1-hour chart,mBDSR (two RCI lines filter) selling signal lights up and the price falls even more.
From this example,Trading method focusing on Pin Bar andthe signal of mBDSR show a high degree of compatibility.
※ Please note that charts shown in this article may have added circles, lines, or rectangles for explanatory convenience.
Indicator that shines when combined with RCI【BODSOR・mBDSR】
Methods and Case Studies (PDF) ★GogoJungle AWARD2020 Winner★
https://www.gogojungle.co.jp/tools/indicators/11836
The PDF file includes 358 items (over 1,400 pages, more than 470,000 characters).
Many of themdocument how to logically link higher and lower timeframes using the RCI 3-line method, progressively examining multiple lower-timeframe scenarios, and ultimately waiting for an entry timing on the lower timeframes (i.e., the mBDSR signal)..
In addition,many focus on capturing points where multiple entry rationales converge..
Also included is a method to explore upside and downside targets using the RCI3-line method.
The PDF explanation usesover 1,350 charts.

Methods and Case Studies (PDF) ★GogoJungle AWARD2020 Winner★
https://www.gogojungle.co.jp/tools/indicators/11836
Gold XAUUSD 1-Hour
Looking at the area circled in white on the 1-hour chart above suggests a potential declinePin Bar (long upper wick candle) has appeared, and it may not be unusual to consider selling on lower timeframes. In this case, thePin Bar is a pattern where traders who jumped in during a strong rise get caught. The crowd’s sentiment may be interpreted as bearish.
Gold XAUUSD 5-Minute
On the 5-minute chart above, after the Pin Bar (long upper wick) appeared on the 1-hour chart,mBDSR (two RCI lines filter) selling signal lights up and the price falls even more.
From this example,Trading method focusing on Pin Bar andthe signal of mBDSR show a high degree of compatibility.
※ Please note that charts shown in this article may have added circles, lines, or rectangles for explanatory convenience.
Indicator that shines when combined with RCI【BODSOR・mBDSR】
Methods and Case Studies (PDF) ★GogoJungle AWARD2020 Winner★
https://www.gogojungle.co.jp/tools/indicators/11836
The PDF file includes 358 items (over 1,400 pages, more than 470,000 characters).
Many of themdocument how to logically link higher and lower timeframes using the RCI 3-line method, progressively examining multiple lower-timeframe scenarios, and ultimately waiting for an entry timing on the lower timeframes (i.e., the mBDSR signal)..
In addition,many focus on capturing points where multiple entry rationales converge..
Also included is a method to explore upside and downside targets using the RCI3-line method.
The PDF explanation usesover 1,350 charts.
× ![]()


