

The moving average line, the return high, and the sign of mBDSR that we regard as important
An indicator that demonstrates power when combined with RCI: BODSOR and mBDSR
Methods and Case Studies (PDF) ★GogoJungle AWARD 2020 Winner★
https://www.gogojungle.co.jp/tools/indicators/11836
AUDJPY 5-minute chart
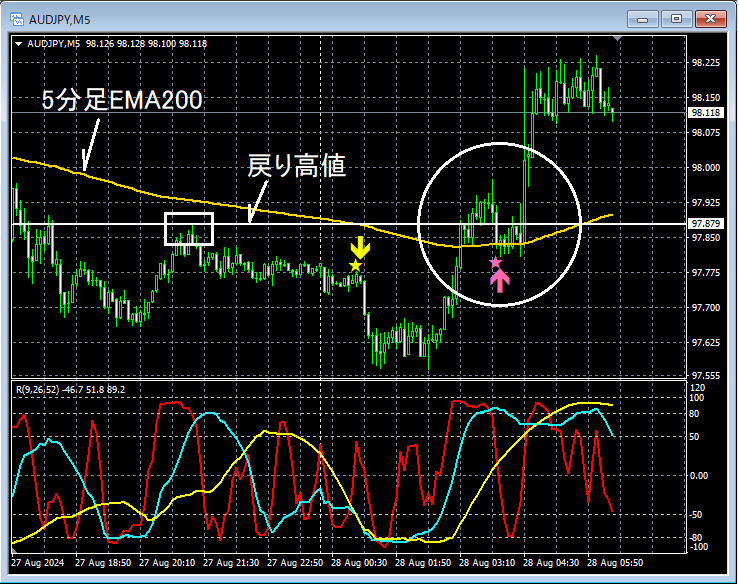
Higher timeframe conditions are omitted.
Retracement highand5-minute EMA200break to the upside. After that, around the5-minute EMA200area,mBDSR (RCI two-line filter) pullback buy signallights up, indicating that price is rising smoothly.
From this example,a trading approach focusing on retracement highs (Dow Theory) and moving averagesandmBDSR signalsshow a high degree of compatibility.
Note: In the charts presented in this article, for convenience in explanation, circles, lines, and rectangles may be added. Please understand this.
An indicator that demonstrates power when combined with RCI: BODSOR and mBDSR
Methods and Case Studies (PDF) ★GogoJungle AWARD 2020 Winner★
https://www.gogojungle.co.jp/tools/indicators/11836
The PDF file includes 358 documents (over 1,400 pages, over 470,000 characters in total).
Most of them are summaries of examples where, by logically linking higher and lower timeframes using three RCI lines, various lower-timeframe conditions are considered sequentially, ultimately waiting for pullback buying or retracement selling timing (i.e., mBDSR signals) on the lower timeframe.
In addition,many focus on capturing points where multiple entry reasons overlap.There are also many that include methods to explore upside and downside targets using the three-RCI-line technique.
In the PDF explanations,
over 1,350 chartsare used.

Methods and Case Studies (PDF) ★GogoJungle AWARD 2020 Winner★
https://www.gogojungle.co.jp/tools/indicators/11836
AUDJPY 5-minute chart
Higher timeframe conditions are omitted.
Retracement highand5-minute EMA200break to the upside. After that, around the5-minute EMA200area,mBDSR (RCI two-line filter) pullback buy signallights up, indicating that price is rising smoothly.
From this example,a trading approach focusing on retracement highs (Dow Theory) and moving averagesandmBDSR signalsshow a high degree of compatibility.
Note: In the charts presented in this article, for convenience in explanation, circles, lines, and rectangles may be added. Please understand this.
An indicator that demonstrates power when combined with RCI: BODSOR and mBDSR
Methods and Case Studies (PDF) ★GogoJungle AWARD 2020 Winner★
https://www.gogojungle.co.jp/tools/indicators/11836
The PDF file includes 358 documents (over 1,400 pages, over 470,000 characters in total).
Most of them are summaries of examples where, by logically linking higher and lower timeframes using three RCI lines, various lower-timeframe conditions are considered sequentially, ultimately waiting for pullback buying or retracement selling timing (i.e., mBDSR signals) on the lower timeframe.
In addition,many focus on capturing points where multiple entry reasons overlap.There are also many that include methods to explore upside and downside targets using the three-RCI-line technique.
In the PDF explanations,
over 1,350 chartsare used.
× ![]()


