

[High Risk-Reward Trade] Potential double bottom formation on higher timeframes and lower timeframe double bottoms with mBDSR (RCI 2-filter) pullback buying signal
Indicator that shines in combination with RCI: BODSOR and mBDSR
Method and case studies (PDF) ★GogoJungle AWARD2020 recipient★
https://www.gogojungle.co.jp/tools/indicators/11836
EUR/JPY 1-hour
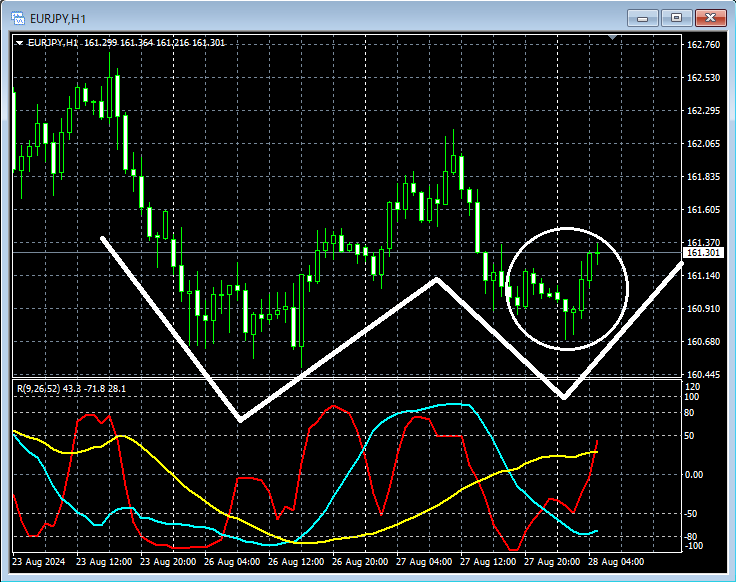
The status of the higher timeframe is omitted. On the 1-hour chart above,double bottommay form, so we will look at the lower timeframe around the area circled in white.
EUR/JPY 5-minute
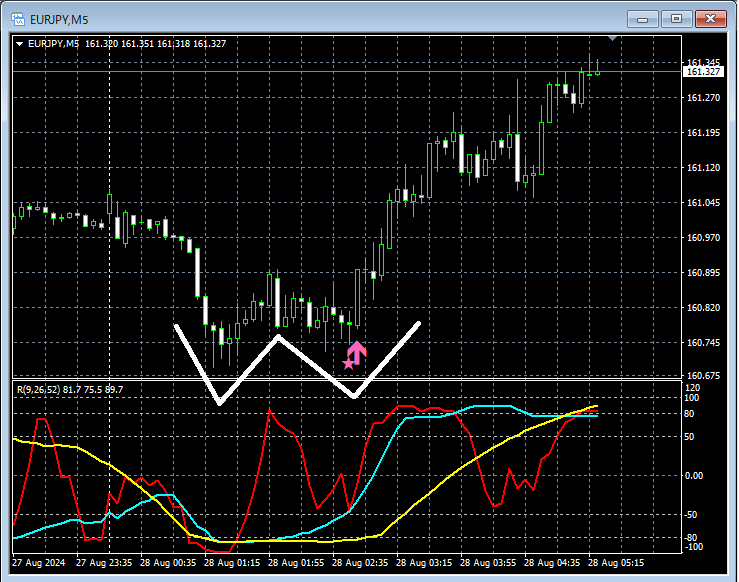
On the 5-minute chart above, as a result, thedouble bottomright-side valleymBDSR (RCI two-filter) pullback-buy signallights up and climbs solidly.
From this example,a trading method focused on the double bottomandthe signal of mBDSRshow high compatibility.
Also in this example, by placing the stop-loss just below the recent low (the left valley of the double bottom),a high-risk-reward tradeis possible.
※Please note that in the charts introduced in this article, for convenience of explanation, circles, lines, and squares may be drawn.
Indicator that shines in combination with RCI: BODSOR and mBDSR
Method and case studies (PDF) ★GogoJungle AWARD2020 recipient★
https://www.gogojungle.co.jp/tools/indicators/11836
The PDF file is included with 358 items (over 1,400 pages, over 470,000 characters in total).
Many of them areexamples that logically link higher and lower timeframes using the RCI three-line indicator, sequentially examining the status of multiple lower timeframes, and ultimately waiting for pullbacks/buying opportunities on lower timeframes (i.e., mBDSR signals)..
Also,many emphasize capturing points where multiple entry reasons overlap..
Furthermore,there are methods that explore upward and downward targets using the three-line RCI indicator..
In the PDF descriptions,more than 1,350 chartsare used.

Method and case studies (PDF) ★GogoJungle AWARD2020 recipient★
https://www.gogojungle.co.jp/tools/indicators/11836
EUR/JPY 1-hour
The status of the higher timeframe is omitted. On the 1-hour chart above,double bottommay form, so we will look at the lower timeframe around the area circled in white.
EUR/JPY 5-minute
On the 5-minute chart above, as a result, thedouble bottomright-side valleymBDSR (RCI two-filter) pullback-buy signallights up and climbs solidly.
From this example,a trading method focused on the double bottomandthe signal of mBDSRshow high compatibility.
Also in this example, by placing the stop-loss just below the recent low (the left valley of the double bottom),a high-risk-reward tradeis possible.
※Please note that in the charts introduced in this article, for convenience of explanation, circles, lines, and squares may be drawn.
Indicator that shines in combination with RCI: BODSOR and mBDSR
Method and case studies (PDF) ★GogoJungle AWARD2020 recipient★
https://www.gogojungle.co.jp/tools/indicators/11836
The PDF file is included with 358 items (over 1,400 pages, over 470,000 characters in total).
Many of them areexamples that logically link higher and lower timeframes using the RCI three-line indicator, sequentially examining the status of multiple lower timeframes, and ultimately waiting for pullbacks/buying opportunities on lower timeframes (i.e., mBDSR signals)..
Also,many emphasize capturing points where multiple entry reasons overlap..
Furthermore,there are methods that explore upward and downward targets using the three-line RCI indicator..
In the PDF descriptions,more than 1,350 chartsare used.
× ![]()


