

[Multiple Entries Basis] Pullback low (Dow Theory) and support-resistance turn and mBDSR (RCI 2-filter) selling signal
Indicator that shines in combination with RCI【BODSOR・mBDSR】
Methods and Case Studies (PDF) ★GogoJungle AWARD 2020 winner★
https://www.gogojungle.co.jp/tools/indicators/11836
USDJPY 5-minute chart
The higher-timeframe situation is omitted. On the upper 5-minute chart,the swing lowwas broken to the downside, andrallied up to near that levelmBDSR (2-line RCI filter)sell signal appeared, and subsequently, price moved down smoothly.
Break of swing lowandrise to past swing highsandthe mBDSR sell signal turned onoverlapping multiple entry reasons can be said to coincide.
From this example,the trade method focusing on Dow Theory and support/resistance turnsandthe signal of mBDSRshow a strong compatibility.
※Please note that in the charts introduced in this article, for convenience of explanation, circles, lines, or rectangles may have been added.
Indicator that shines in combination with RCI【BODSOR・mBDSR】
Methods and Case Studies (PDF) ★GogoJungle AWARD 2020 winner★
https://www.gogojungle.co.jp/tools/indicators/11836
The PDF file includes 358 items (over 1,400 pages, over 470,000 characters).
Many of them are examples that lay out a process in which multiple higher and lower timeframes are logically linked using the 3-RCI lines, ultimately waiting for the timing to buy on dips or sell on rallies on the lower timeframe (i.e., the mBDSR signals).
Additionally,many of them emphasize identifying points where multiple entry reasons overlap.There are also many that focus on highlighting such overlapping entry points.
Furthermore,there are methods that explore ascent and descent targets using the 3-RCI lines.Also included.
In the explanations within the PDF files,more than 1,350 chartsare used.

Methods and Case Studies (PDF) ★GogoJungle AWARD 2020 winner★
https://www.gogojungle.co.jp/tools/indicators/11836
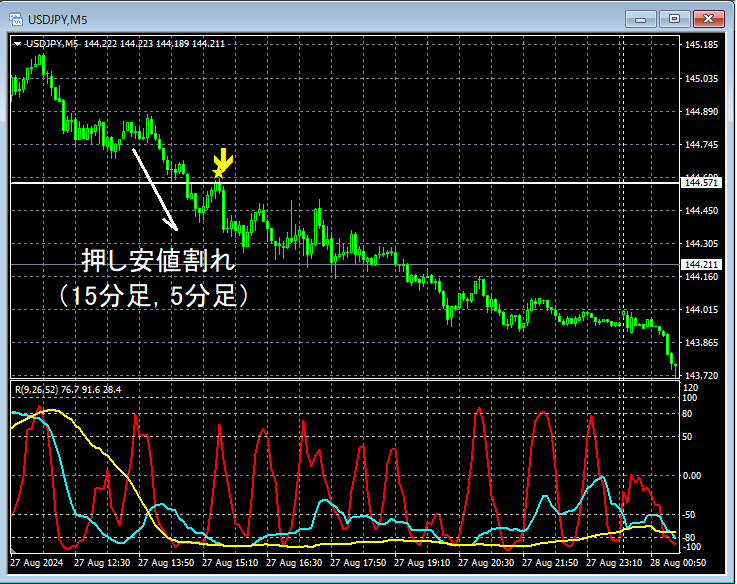
USDJPY 5-minute chart
The higher-timeframe situation is omitted. On the upper 5-minute chart,the swing lowwas broken to the downside, andrallied up to near that levelmBDSR (2-line RCI filter)sell signal appeared, and subsequently, price moved down smoothly.
Break of swing lowandrise to past swing highsandthe mBDSR sell signal turned onoverlapping multiple entry reasons can be said to coincide.
From this example,the trade method focusing on Dow Theory and support/resistance turnsandthe signal of mBDSRshow a strong compatibility.
※Please note that in the charts introduced in this article, for convenience of explanation, circles, lines, or rectangles may have been added.
Indicator that shines in combination with RCI【BODSOR・mBDSR】
Methods and Case Studies (PDF) ★GogoJungle AWARD 2020 winner★
https://www.gogojungle.co.jp/tools/indicators/11836
The PDF file includes 358 items (over 1,400 pages, over 470,000 characters).
Many of them are examples that lay out a process in which multiple higher and lower timeframes are logically linked using the 3-RCI lines, ultimately waiting for the timing to buy on dips or sell on rallies on the lower timeframe (i.e., the mBDSR signals).
Additionally,many of them emphasize identifying points where multiple entry reasons overlap.There are also many that focus on highlighting such overlapping entry points.
Furthermore,there are methods that explore ascent and descent targets using the 3-RCI lines.Also included.
In the explanations within the PDF files,more than 1,350 chartsare used.
× ![]()


