

Past resistance lines and mbDSR (RCI2 two-filter) pullback buy signal (2)
Indicator with strong power when combined with RCI【BODSOR・mBDSR】
Methods, cases studies (PDF) ★GogoJungle AWARD 2020 winner★
https://www.gogojungle.co.jp/tools/indicators/11836
EURJPY 30-minute chart
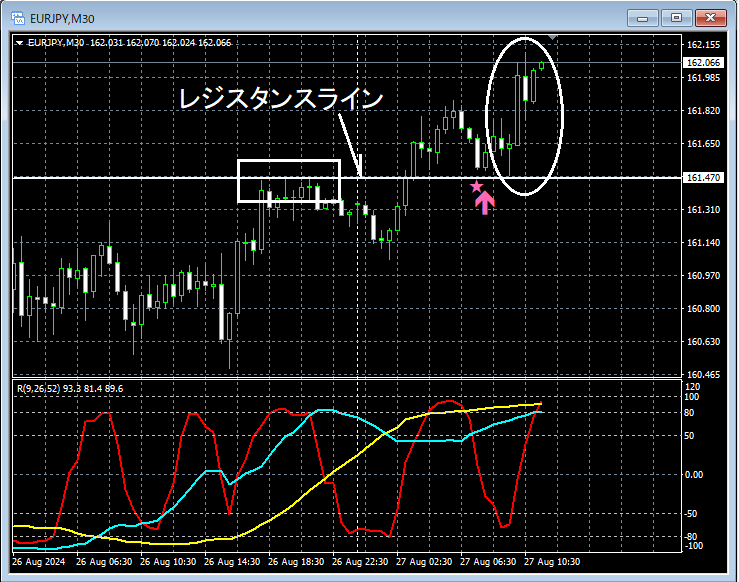
On the above 30-minute chart,Resistance linewas broken to the upside, then price retraced toward near that line again,mBDSR (two RCI filters) buy signallighted up, and subsequently price rose smoothly (so-calledroll reversal (support-resistance flip)).
Here, we will further examine around the area encircled by the white ellipse on a lower time frame.
EURJPY 1-minute chart
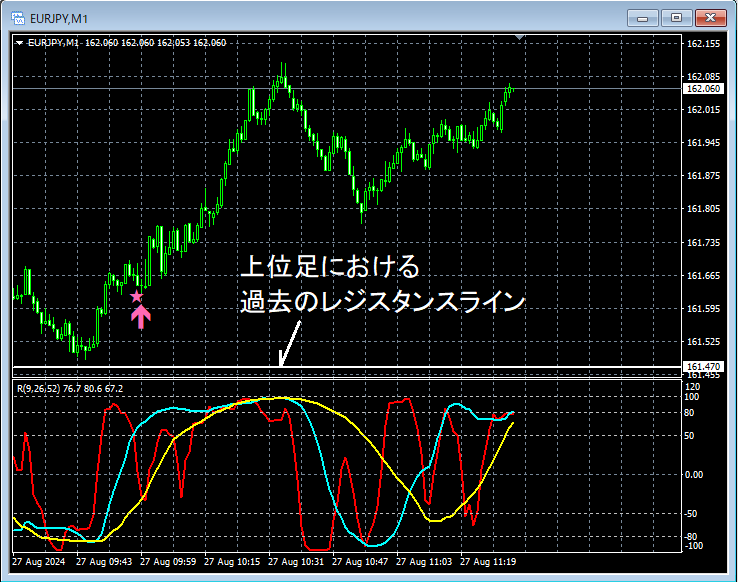
On the above 1-minute chart,near the past resistance line on the higher time framethere is a slight rebound.mBDSR (two RCI filters) buy signallights up, and subsequently price rises smoothly.
Rebound near past resistance line (prominent high) and,mBDSR buy signallighting up—these provide multiple entry reasons that coincide.
From this example,a trading approach focused on past resistance lines (prominent highs) and roll reversals (resistance-support flips)andthe signals of mBDSRshow strong compatibility.
Additionally, in the 1-minute chart signals above, by placing the stop loss slightly below the recent low, arisk-reward favorable tradeis possible.
※Some charts introduced in this article may have added circles, lines, or rectangles for explanatory convenience, please understand.
Indicator with strong power when combined with RCI【BODSOR・mBDSR】
Methods, cases studies (PDF) ★GogoJungle AWARD 2020 winner★
https://www.gogojungle.co.jp/tools/indicators/11836
The PDF file includes 358 items (over 1,400 pages, over 470,000 characters in total).
Many of themexplain logically linking the higher and lower time frames using 3 RCI lines, sequentially considering multiple lower time frames, and ultimately waiting for pullbacks or retracements timing (i.e., mBDSR signals) on the lower time frames..
Also,many focus on capturing points where multiple entry reasons coincide..
In addition,there are methods exploring upside and downside targets using three-line RCI..
In the PDF explanations,over 1,350 chartsare used.

Methods, cases studies (PDF) ★GogoJungle AWARD 2020 winner★
https://www.gogojungle.co.jp/tools/indicators/11836
EURJPY 30-minute chart
On the above 30-minute chart,Resistance linewas broken to the upside, then price retraced toward near that line again,mBDSR (two RCI filters) buy signallighted up, and subsequently price rose smoothly (so-calledroll reversal (support-resistance flip)).
Here, we will further examine around the area encircled by the white ellipse on a lower time frame.
EURJPY 1-minute chart
On the above 1-minute chart,near the past resistance line on the higher time framethere is a slight rebound.mBDSR (two RCI filters) buy signallights up, and subsequently price rises smoothly.
Rebound near past resistance line (prominent high) and,mBDSR buy signallighting up—these provide multiple entry reasons that coincide.
From this example,a trading approach focused on past resistance lines (prominent highs) and roll reversals (resistance-support flips)andthe signals of mBDSRshow strong compatibility.
Additionally, in the 1-minute chart signals above, by placing the stop loss slightly below the recent low, arisk-reward favorable tradeis possible.
※Some charts introduced in this article may have added circles, lines, or rectangles for explanatory convenience, please understand.
Indicator with strong power when combined with RCI【BODSOR・mBDSR】
Methods, cases studies (PDF) ★GogoJungle AWARD 2020 winner★
https://www.gogojungle.co.jp/tools/indicators/11836
The PDF file includes 358 items (over 1,400 pages, over 470,000 characters in total).
Many of themexplain logically linking the higher and lower time frames using 3 RCI lines, sequentially considering multiple lower time frames, and ultimately waiting for pullbacks or retracements timing (i.e., mBDSR signals) on the lower time frames..
Also,many focus on capturing points where multiple entry reasons coincide..
In addition,there are methods exploring upside and downside targets using three-line RCI..
In the PDF explanations,over 1,350 chartsare used.
× ![]()


