

Past resistance line and the mBDSR (RCI2 two-filter) pullback buy signal (1)
An indicator that shines in combination with RCI: BODSOR and mBDSR
Method and Case Study (PDF) ★GogoJungle AWARD2020 Winner★
https://www.gogojungle.co.jp/tools/indicators/11836
GBP/JPY, 30-minute chart
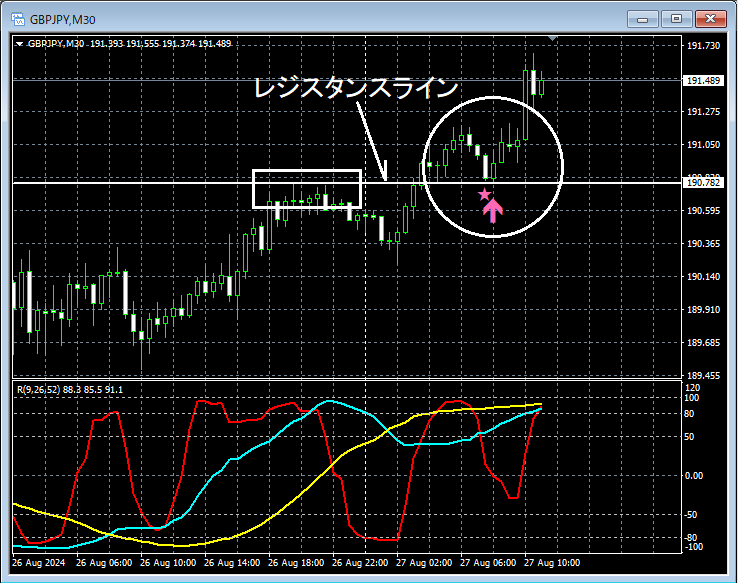
On the above 30-minute chart,Resistance lineis broken to the upside, then it pulls back near that line again,mBDSR (two RCI filters) buy-the-dip signallights up, and the price rises smoothly (so-calledroll reversal (support-resistance inversion)).
A pullback toward a past resistance line (prominent high) areaandmBDSR (RCI two-filter) buy-the-dip signal activationoverlap as multiple entry rationales.
From this example,there is a strong synergy between trade methods that focus on past resistance lines (prominent highs) and roll reversals (support-resistance inversion)andthe signals from mBDSR.
※Please note that in the charts presented in this article, for convenience of explanation, circles, lines, and rectangles may have been added.
An indicator that shines in combination with RCI: BODSOR and mBDSR
Method and Case Study (PDF) ★GogoJungle AWARD2020 Winner★
https://www.gogojungle.co.jp/tools/indicators/11836
The PDF file comes with 358 files (over 1,400 pages, over 470,000 words in total).
Most of these are a collection of examples that describe how to logically link higher-timeframe and lower-timeframe using three RCI lines, and ultimately wait for the timing of pullbacks or retracements on the lower timeframes (i.e., the mBDSR signals).
Additionally,there are many entries that emphasize identifying points where multiple entry rationales converge..
Furthermore,there are methods for exploring upward and downward targets using three RCI lines..
In the explanations within the PDF file,more than 1,350 chartsare used.

Method and Case Study (PDF) ★GogoJungle AWARD2020 Winner★
https://www.gogojungle.co.jp/tools/indicators/11836
GBP/JPY, 30-minute chart
On the above 30-minute chart,Resistance lineis broken to the upside, then it pulls back near that line again,mBDSR (two RCI filters) buy-the-dip signallights up, and the price rises smoothly (so-calledroll reversal (support-resistance inversion)).
A pullback toward a past resistance line (prominent high) areaandmBDSR (RCI two-filter) buy-the-dip signal activationoverlap as multiple entry rationales.
From this example,there is a strong synergy between trade methods that focus on past resistance lines (prominent highs) and roll reversals (support-resistance inversion)andthe signals from mBDSR.
※Please note that in the charts presented in this article, for convenience of explanation, circles, lines, and rectangles may have been added.
An indicator that shines in combination with RCI: BODSOR and mBDSR
Method and Case Study (PDF) ★GogoJungle AWARD2020 Winner★
https://www.gogojungle.co.jp/tools/indicators/11836
The PDF file comes with 358 files (over 1,400 pages, over 470,000 words in total).
Most of these are a collection of examples that describe how to logically link higher-timeframe and lower-timeframe using three RCI lines, and ultimately wait for the timing of pullbacks or retracements on the lower timeframes (i.e., the mBDSR signals).
Additionally,there are many entries that emphasize identifying points where multiple entry rationales converge..
Furthermore,there are methods for exploring upward and downward targets using three RCI lines..
In the explanations within the PDF file,more than 1,350 chartsare used.
× ![]()


