

[Today's USD/JPY Strategy] Rebound at the moving average we monitor and the mBDSR (RCI two-filter) buy-the-dip signal August 27, 2024
0
Indicator that captures the bottom, reversal in combination with RCI: 【mBDSR】
Methods, case studies (PDF) ★GogoJungle AWARD2020 Winner★
https://www.gogojungle.co.jp/tools/indicators/11836
The above products include 301 PDFs. For a list of titles of those PDFs, please refer to the article below.
About the 301 PDF files included with 【BODSOR・mBDSR】
https://www.gogojungle.co.jp/finance/navi/articles/34271
USD/JPY 30-minute chart
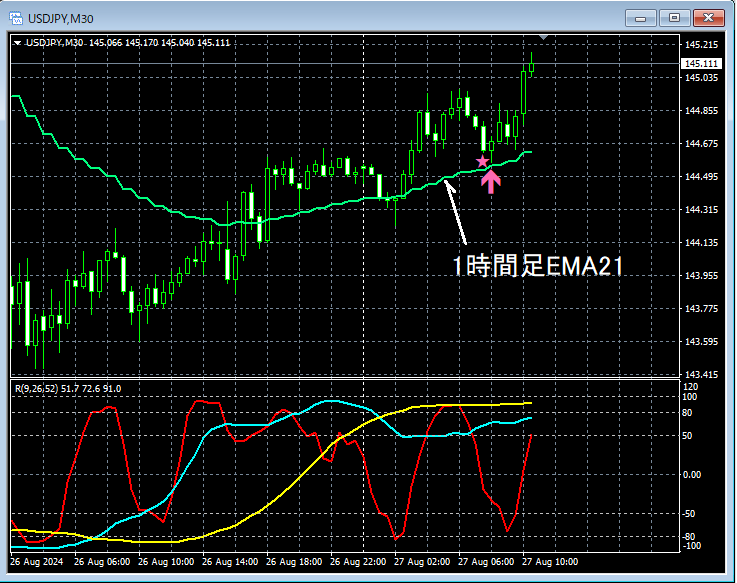
The higher time-frame context is omitted. On the 30-minute chart above, the focus isEMA21 on the 1-hour chartas it drops toward a nearby areamBDSR (RCI with 2 lines) pullback-buy signallights up, and prices rise steadily immediately after.
From this example,a trading method focused on the important moving averagesandthe signal of mBDSRshow a strong compatibility.
Indicator that shines in combination with RCI: 【BODSOR・mBDSR】
Methods, case studies (PDF) ★GogoJungle AWARD2020 Winner★
https://www.gogojungle.co.jp/tools/indicators/11836
The PDF files include 301 files (over 1,000 pages, over 350,000 characters in total).
Many of them are about logically linking higher and lower time frames by using three RCI lines, examining multiple lower-time-frame contexts sequentially, and ultimately waiting for pullbacks or reversals on the lower time frame (i.e., mBDSR signals).This is what they have summarized.
Also,many focus on identifying points where multiple entry reasons overlap.
In the explanations,over 1,000 chartswere used.

Methods, case studies (PDF) ★GogoJungle AWARD2020 Winner★
https://www.gogojungle.co.jp/tools/indicators/11836
The above products include 301 PDFs. For a list of titles of those PDFs, please refer to the article below.
About the 301 PDF files included with 【BODSOR・mBDSR】
https://www.gogojungle.co.jp/finance/navi/articles/34271
USD/JPY 30-minute chart
The higher time-frame context is omitted. On the 30-minute chart above, the focus isEMA21 on the 1-hour chartas it drops toward a nearby areamBDSR (RCI with 2 lines) pullback-buy signallights up, and prices rise steadily immediately after.
From this example,a trading method focused on the important moving averagesandthe signal of mBDSRshow a strong compatibility.
Indicator that shines in combination with RCI: 【BODSOR・mBDSR】
Methods, case studies (PDF) ★GogoJungle AWARD2020 Winner★
https://www.gogojungle.co.jp/tools/indicators/11836
The PDF files include 301 files (over 1,000 pages, over 350,000 characters in total).
Many of them are about logically linking higher and lower time frames by using three RCI lines, examining multiple lower-time-frame contexts sequentially, and ultimately waiting for pullbacks or reversals on the lower time frame (i.e., mBDSR signals).This is what they have summarized.
Also,many focus on identifying points where multiple entry reasons overlap.
In the explanations,over 1,000 chartswere used.
× ![]()


