

[Good Risk-Reward Trade] A breakout to a standout high, roll reversal (support/resistance flip), and mBDSR (RCI double filter) pullback buying signal
Indicator that shines when combined with RCI: BODSOR・mBDSR
Methods and Case Studies (PDF) ★GogoJungle AWARD2020 Winner★
https://www.gogojungle.co.jp/tools/indicators/11836
AUDUSD 15-minute chart
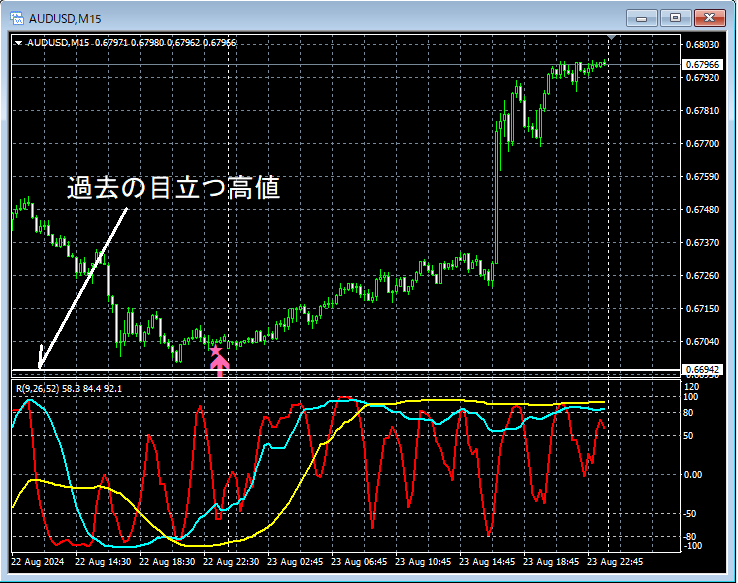
On the 15-minute chart above,near the notable past highas it has dropped to around that level,the mBDSR (two RCI lines filter) pullback buy signallights up, and price begins to rise smoothly right afterward (a so-calledroll reversal (support-resistance turn)).
Drop to near the past notable highandthe mBDSR (two RCI lines filter) pullback buy signal lights upoverlapping as multiple entry grounds can be said to converge.
From this example,a trading method that focuses on notable highs and roll reversals (support-resistance turns)andthe signals of mBDSRshow a strong compatibility.
Additionally, in this example, placing the stop loss just below the most recent lowand the followingpresents a trade with a favorable risk-reward profile.
※Note: In the charts introduced in this article, for convenience of explanation, circles, lines, and squares may be drawn.
Indicator that shines when combined with RCI: BODSOR・mBDSR
Methods and Case Studies (PDF) ★GogoJungle AWARD2020 Winner★
https://www.gogojungle.co.jp/tools/indicators/11836
The PDF file comes with 358 items (over 1,400 pages, over 470,000 characters in total).
Most of them arecases that lay out how to logically link higher and lower timeframes using three RCI lines to sequentially consider the状況 of multiple lower timeframes, ultimately waiting for pullbacks or retracements (i.e., mBDSR signals) on lower timeframes..
Also,many entries focus on capturing points where multiple entry grounds overlap..
Additionally,there are methods that explore upward and downward targets using three RCIs..
In the explanations within the PDF file,over 1,350 chartsare used.

Methods and Case Studies (PDF) ★GogoJungle AWARD2020 Winner★
https://www.gogojungle.co.jp/tools/indicators/11836
AUDUSD 15-minute chart
On the 15-minute chart above,near the notable past highas it has dropped to around that level,the mBDSR (two RCI lines filter) pullback buy signallights up, and price begins to rise smoothly right afterward (a so-calledroll reversal (support-resistance turn)).
Drop to near the past notable highandthe mBDSR (two RCI lines filter) pullback buy signal lights upoverlapping as multiple entry grounds can be said to converge.
From this example,a trading method that focuses on notable highs and roll reversals (support-resistance turns)andthe signals of mBDSRshow a strong compatibility.
Additionally, in this example, placing the stop loss just below the most recent lowand the followingpresents a trade with a favorable risk-reward profile.
※Note: In the charts introduced in this article, for convenience of explanation, circles, lines, and squares may be drawn.
Indicator that shines when combined with RCI: BODSOR・mBDSR
Methods and Case Studies (PDF) ★GogoJungle AWARD2020 Winner★
https://www.gogojungle.co.jp/tools/indicators/11836
The PDF file comes with 358 items (over 1,400 pages, over 470,000 characters in total).
Most of them arecases that lay out how to logically link higher and lower timeframes using three RCI lines to sequentially consider the状況 of multiple lower timeframes, ultimately waiting for pullbacks or retracements (i.e., mBDSR signals) on lower timeframes..
Also,many entries focus on capturing points where multiple entry grounds overlap..
Additionally,there are methods that explore upward and downward targets using three RCIs..
In the explanations within the PDF file,over 1,350 chartsare used.
× ![]()


