

Prominent lows and roll reversals and mBDSR (RCI2 two-filter) backtesting sell signal
Indicator that shines in combination with RCI: BODSOR・mBDSR
Methods, and Case Studies (PDF) ★GogoJungle AWARD2020 winner★
https://www.gogojungle.co.jp/tools/indicators/11836
USDJPY 5-minute chart
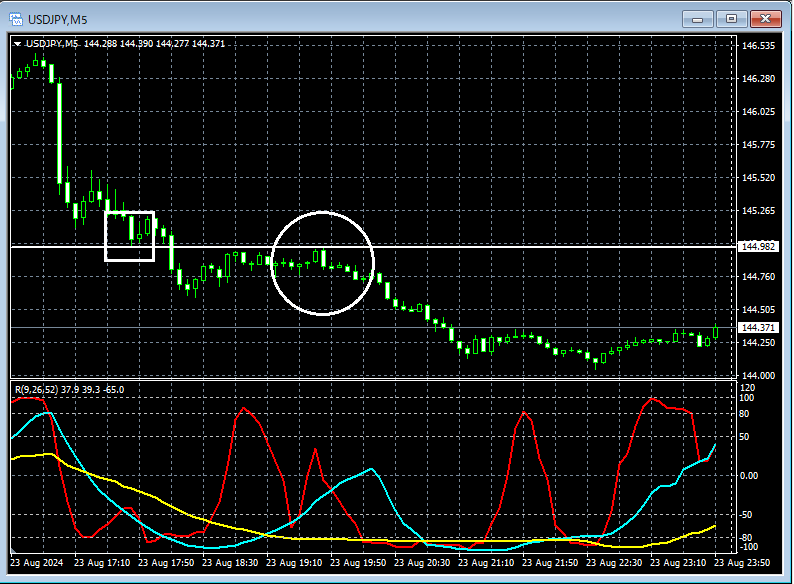
Around the area circled in white on the 5-minute chart above,notable lowhas retraced to near that area. We will examine the behavior in the lower time frame (1-minute chart).
USDJPY 1-minute chart
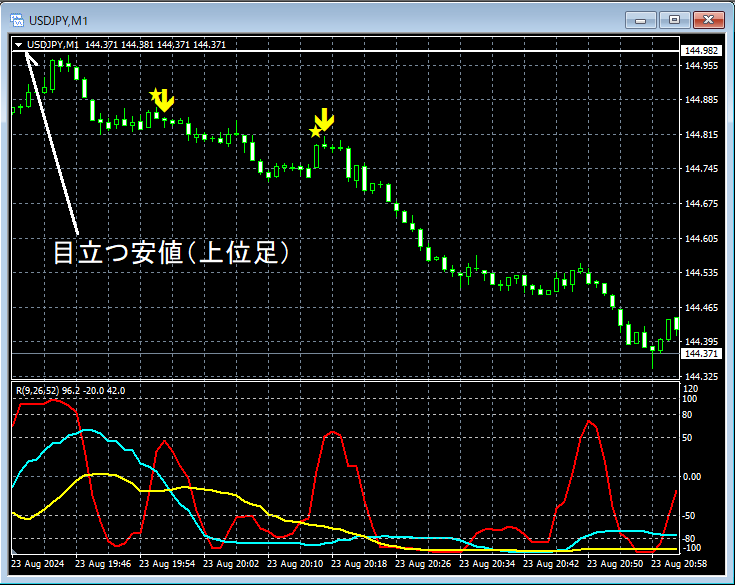
On the 1-minute chart above,notable low on the higher time framerises to near that level and then reverses.mBDSR (two RCI lines filter) overbought signallights up twice, and the price declines smoothly (the so-calledrole reversal (support-resistance flip)).
Reversal from around the notable low on the higher time frameandmBDSR (two RCI lines filter) overbought signal activationoverlap as multiple entry reasons.
From this example,the trade technique focusing on notable lows and role reversals (support-resistance flips)andthe signals of mBDSRshow a strong compatibility.
Note: In the charts presented in this article, circles, lines, and rectangles may be drawn for readability.
Indicator that shines in combination with RCI: BODSOR・mBDSR
Methods, and Case Studies (PDF) ★GogoJungle AWARD2020 winner★
https://www.gogojungle.co.jp/tools/indicators/11836
The PDF file includes 358 documents (over 1,400 pages, over 470,000 characters).
Many of these consist of examples that logically link higher and lower time frames using three RCI lines, and ultimately outline a form that waits for timing of pullbacks on the lower time frame (i.e., the signals of mBDSR).
Additionally,many focus on identifying points where multiple entry reasons coincide.There are also many that include a method to explore upside and downside targets using three RCI lines.
Furthermore,the material includes a method for exploring upward and downward targets using three RCI lines..
In the PDF descriptions,more than 1,350 chartsare used.

Methods, and Case Studies (PDF) ★GogoJungle AWARD2020 winner★
https://www.gogojungle.co.jp/tools/indicators/11836
USDJPY 5-minute chart
Around the area circled in white on the 5-minute chart above,notable lowhas retraced to near that area. We will examine the behavior in the lower time frame (1-minute chart).
USDJPY 1-minute chart
On the 1-minute chart above,notable low on the higher time framerises to near that level and then reverses.mBDSR (two RCI lines filter) overbought signallights up twice, and the price declines smoothly (the so-calledrole reversal (support-resistance flip)).
Reversal from around the notable low on the higher time frameandmBDSR (two RCI lines filter) overbought signal activationoverlap as multiple entry reasons.
From this example,the trade technique focusing on notable lows and role reversals (support-resistance flips)andthe signals of mBDSRshow a strong compatibility.
Note: In the charts presented in this article, circles, lines, and rectangles may be drawn for readability.
Indicator that shines in combination with RCI: BODSOR・mBDSR
Methods, and Case Studies (PDF) ★GogoJungle AWARD2020 winner★
https://www.gogojungle.co.jp/tools/indicators/11836
The PDF file includes 358 documents (over 1,400 pages, over 470,000 characters).
Many of these consist of examples that logically link higher and lower time frames using three RCI lines, and ultimately outline a form that waits for timing of pullbacks on the lower time frame (i.e., the signals of mBDSR).
Additionally,many focus on identifying points where multiple entry reasons coincide.There are also many that include a method to explore upside and downside targets using three RCI lines.
Furthermore,the material includes a method for exploring upward and downward targets using three RCI lines..
In the PDF descriptions,more than 1,350 chartsare used.
× ![]()


