

Prominent high price and a pullback buy signal with roll reversal and mBDSR (RCI2 double filter)
Indicator that shines in combination with RCI: BODSOR・mBDSR
Methods and Case Studies (PDF) ★GogoJungle AWARD2020 Winner★
https://www.gogojungle.co.jp/tools/indicators/11836
EURUSD 15-minute chart
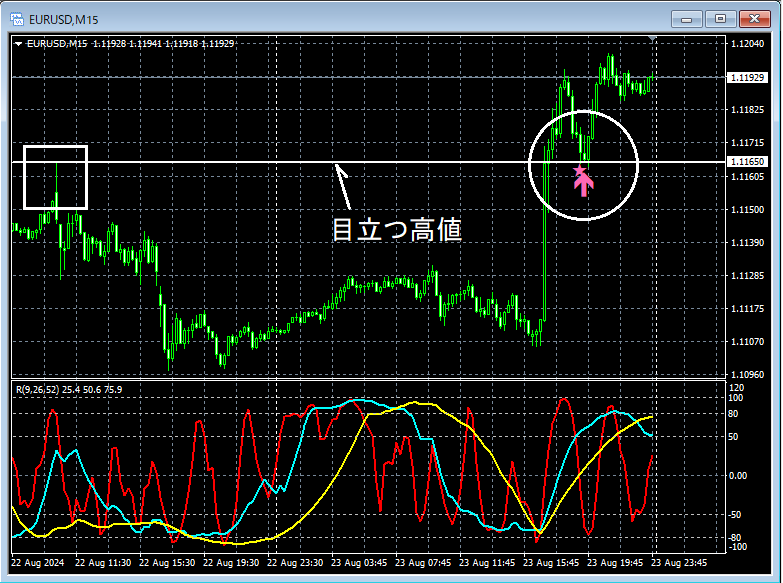
In the 15-minute chart above,decline close to a noticeable highappears,mBDSR (two RCI lines filter) buy signal is litand price rises smoothly from right after that (so-calledRoll Reversal (support-resistance flipped)).
The drop toward the prominent highandmBDSR (two RCI lines filter) buy signal litoverlap as multiple entry reasons.
From this example,a trading approach focusing on noticeable highs and Roll Reversal (support-resistance flips)andthe signals of mBDSRshow strong synergy.
※Please note that in the charts introduced in this article, for convenience of explanation, circles, lines, rectangles, etc. may be drawn.
Indicator that shines in combination with RCI: BODSOR・mBDSR
Methods and Case Studies (PDF) ★GogoJungle AWARD2020 Winner★
https://www.gogojungle.co.jp/tools/indicators/11836
The PDF file comes with 358 items (over 1,400 pages, over 470,000 characters).
Many of them are summaries of cases where, by using three RCI lines to logically link higher and lower timeframes, multiple lower-timeframe situations are considered sequentially, ultimately waiting for a pullback buy or pullback sell timing (i.e., mBDSR signals) on the lower timeframe.
Also,there are many that emphasize identifying points where multiple entry reasons align..
Additionally,there are methods that explore upside and downside targets using three RCI lines..
In the explanations within the PDF file,over 1,350 chartsare used.

Methods and Case Studies (PDF) ★GogoJungle AWARD2020 Winner★
https://www.gogojungle.co.jp/tools/indicators/11836
EURUSD 15-minute chart
In the 15-minute chart above,decline close to a noticeable highappears,mBDSR (two RCI lines filter) buy signal is litand price rises smoothly from right after that (so-calledRoll Reversal (support-resistance flipped)).
The drop toward the prominent highandmBDSR (two RCI lines filter) buy signal litoverlap as multiple entry reasons.
From this example,a trading approach focusing on noticeable highs and Roll Reversal (support-resistance flips)andthe signals of mBDSRshow strong synergy.
※Please note that in the charts introduced in this article, for convenience of explanation, circles, lines, rectangles, etc. may be drawn.
Indicator that shines in combination with RCI: BODSOR・mBDSR
Methods and Case Studies (PDF) ★GogoJungle AWARD2020 Winner★
https://www.gogojungle.co.jp/tools/indicators/11836
The PDF file comes with 358 items (over 1,400 pages, over 470,000 characters).
Many of them are summaries of cases where, by using three RCI lines to logically link higher and lower timeframes, multiple lower-timeframe situations are considered sequentially, ultimately waiting for a pullback buy or pullback sell timing (i.e., mBDSR signals) on the lower timeframe.
Also,there are many that emphasize identifying points where multiple entry reasons align..
Additionally,there are methods that explore upside and downside targets using three RCI lines..
In the explanations within the PDF file,over 1,350 chartsare used.
× ![]()


