

[Good Risk-Reward Trade] Return-selling signal on rising wedge and mBDSR (RCI 2-line filter)
Indicator that shines when combined with RCI: 【BODSOR・mBDSR】
and Method & Case Studies (PDF) ★GogoJungle AWARD 2020 Winner★
https://www.gogojungle.co.jp/tools/indicators/11836
EUR/CHF 4-hour chart
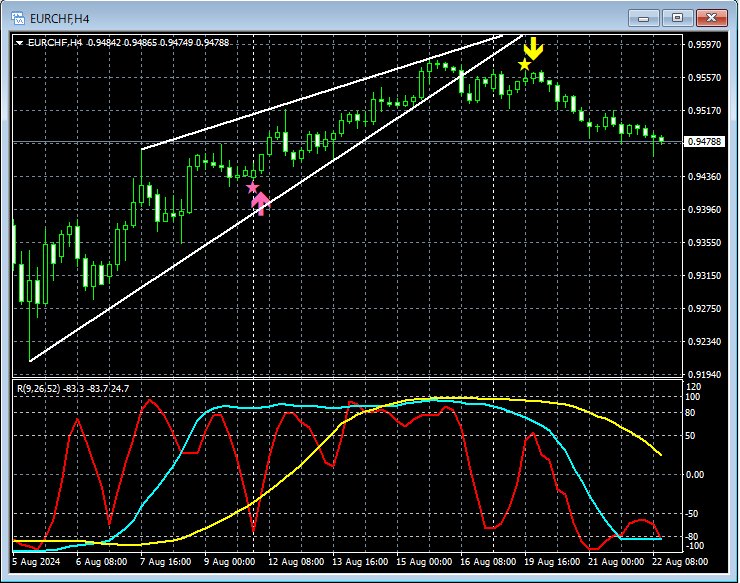
On the 4-hour chart above,the lower boundary of the rising wedge being brokenand the subsequent rise,mBDSR (two RCI lines) sell-off signallights up, and thereafter the price has moved lower firmly.
Break below the lower boundary of the rising wedgeandthe mBDSR sell-off signal lights upoverlap as multiple entry reasons.
From this example,the trading method that focuses on wedgesandthe signal of mBDSRshow a high degree of compatibility.
Additionally, in this example, placing the stop-loss just above the recent highand other measuresallows for a favorable reward-to-risk trade.
※ Please note that in the charts presented in this article, for convenience of explanation, circles, straight lines, and rectangles may be drawn.
Indicator that shines when combined with RCI: 【BODSOR・mBDSR】
and Method & Case Studies (PDF) ★GogoJungle AWARD 2020 Winner★
https://www.gogojungle.co.jp/tools/indicators/11836
The PDF file includes 358 items (over 1,400 pages, over 470,000 characters in total).
Most of them are summarized in the form of investigating multiple lower-timeframe conditions logically by linking higher and lower timeframes using the three RCI lines, and ultimately waiting for a timing to buy on dips or sell on rallies on the lower timeframes (i.e., the mBDSR signal).
Additionally,many of them emphasize capturing points where multiple entry reasons coincide..
Furthermore,there are also methods that explore upward and downward targets using the three RCI lines..
In the explanations within the PDF file,more than 1,350 chartsare used.

and Method & Case Studies (PDF) ★GogoJungle AWARD 2020 Winner★
https://www.gogojungle.co.jp/tools/indicators/11836
EUR/CHF 4-hour chart
On the 4-hour chart above,the lower boundary of the rising wedge being brokenand the subsequent rise,mBDSR (two RCI lines) sell-off signallights up, and thereafter the price has moved lower firmly.
Break below the lower boundary of the rising wedgeandthe mBDSR sell-off signal lights upoverlap as multiple entry reasons.
From this example,the trading method that focuses on wedgesandthe signal of mBDSRshow a high degree of compatibility.
Additionally, in this example, placing the stop-loss just above the recent highand other measuresallows for a favorable reward-to-risk trade.
※ Please note that in the charts presented in this article, for convenience of explanation, circles, straight lines, and rectangles may be drawn.
Indicator that shines when combined with RCI: 【BODSOR・mBDSR】
and Method & Case Studies (PDF) ★GogoJungle AWARD 2020 Winner★
https://www.gogojungle.co.jp/tools/indicators/11836
The PDF file includes 358 items (over 1,400 pages, over 470,000 characters in total).
Most of them are summarized in the form of investigating multiple lower-timeframe conditions logically by linking higher and lower timeframes using the three RCI lines, and ultimately waiting for a timing to buy on dips or sell on rallies on the lower timeframes (i.e., the mBDSR signal).
Additionally,many of them emphasize capturing points where multiple entry reasons coincide..
Furthermore,there are also methods that explore upward and downward targets using the three RCI lines..
In the explanations within the PDF file,more than 1,350 chartsare used.
× ![]()


