

[Good Risk-Reward Trade] Higher-timeframe pullback high (resistance) and mBDSR (RCI two-filter) pullback sell signal
Indicator that shines when used with RCI: BODSOR・mBDSR
Methods, case studies (PDF) ★GogoJungle AWARD2020 Winner★
https://www.gogojungle.co.jp/tools/indicators/11836
Gold XAUUSD 15-minute chart
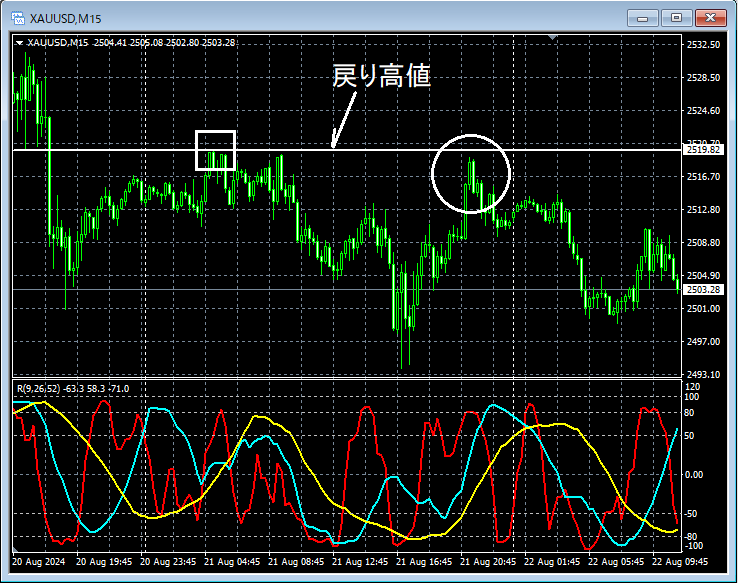
On the 15-minute chart above, around the white circle,the price has risen toward the retracement highnearby. We will examine on lower timeframes for signs of reversal.
Gold XAUUSD 5-minute chart
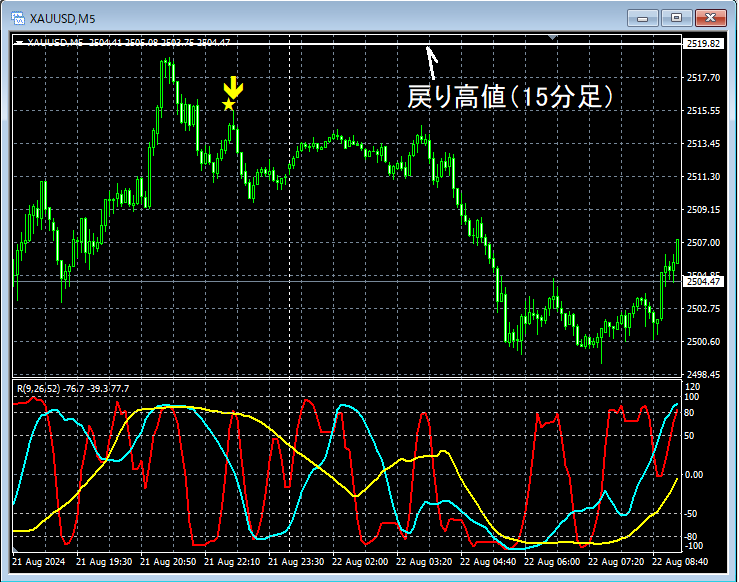
On the 5-minute chart above,retracement high (15-minute level)the price rose to around this point and then reversed. After that,mBDSR (two RCI lines filter) retracement sell signallit up and declined further.
Rise toward the retracement high on the higher timeframeandthe mBDSR retracement sell signalare overlapping as multiple entry grounds.
From this example,a trading method focusing on retracement highs (Dow Theory)andthe signals from mBDSRshow high compatibility.
Additionally, in this example, by placing the stop-loss just above the most recent higha favorable risk-reward trade is achievable.
※Please note that in the charts introduced in this article, for ease of explanation, circles, lines, and rectangles may have been drawn.
Indicator that shines when used with RCI: BODSOR・mBDSR
Methods, case studies (PDF) ★GogoJungle AWARD2020 Winner★
https://www.gogojungle.co.jp/tools/indicators/11836
The PDF file contains 358 documents (over 1,400 pages, over 470,000 characters).
Many of theseexplain how to logically link higher and lower timeframes using the RCI three-line setup, sequentially analyze multiple lower timeframes, and ultimately wait for pullbacks or retracements in the lower timeframes (i.e., mBDSR signals)..
Moreover,many focus on capturing points where multiple entry grounds converge..
In addition,is also included.
In the PDF explanations,over 1,350 chartsare used.

Methods, case studies (PDF) ★GogoJungle AWARD2020 Winner★
https://www.gogojungle.co.jp/tools/indicators/11836
Gold XAUUSD 15-minute chart
On the 15-minute chart above, around the white circle,the price has risen toward the retracement highnearby. We will examine on lower timeframes for signs of reversal.
Gold XAUUSD 5-minute chart
On the 5-minute chart above,retracement high (15-minute level)the price rose to around this point and then reversed. After that,mBDSR (two RCI lines filter) retracement sell signallit up and declined further.
Rise toward the retracement high on the higher timeframeandthe mBDSR retracement sell signalare overlapping as multiple entry grounds.
From this example,a trading method focusing on retracement highs (Dow Theory)andthe signals from mBDSRshow high compatibility.
Additionally, in this example, by placing the stop-loss just above the most recent higha favorable risk-reward trade is achievable.
※Please note that in the charts introduced in this article, for ease of explanation, circles, lines, and rectangles may have been drawn.
Indicator that shines when used with RCI: BODSOR・mBDSR
Methods, case studies (PDF) ★GogoJungle AWARD2020 Winner★
https://www.gogojungle.co.jp/tools/indicators/11836
The PDF file contains 358 documents (over 1,400 pages, over 470,000 characters).
Many of theseexplain how to logically link higher and lower timeframes using the RCI three-line setup, sequentially analyze multiple lower timeframes, and ultimately wait for pullbacks or retracements in the lower timeframes (i.e., mBDSR signals)..
Moreover,many focus on capturing points where multiple entry grounds converge..
In addition,is also included.
In the PDF explanations,over 1,350 chartsare used.
× ![]()


