

【Dollar/Yen Strategy】Pin Bar (candle with a long upper wick) and mBDSR (RCI two-filter) Rebound Sell Signal from yesterday's (August 21, 2024) chart
Indicator that captures “tops and bottoms and reversals” in combination with RCI: 【mBDSR】
Methods and Case Studies (PDF) ★GogoJungle AWARD2020 Winner★
https://www.gogojungle.co.jp/tools/indicators/11836
The above products include 301 PDFs. For a list of the PDF titles and other details, please see the article below.
About the 301 attached PDF files for 【BODSOR・mBDSR】
https://www.gogojungle.co.jp/finance/navi/articles/34271
USD/JPY 15-minute chart
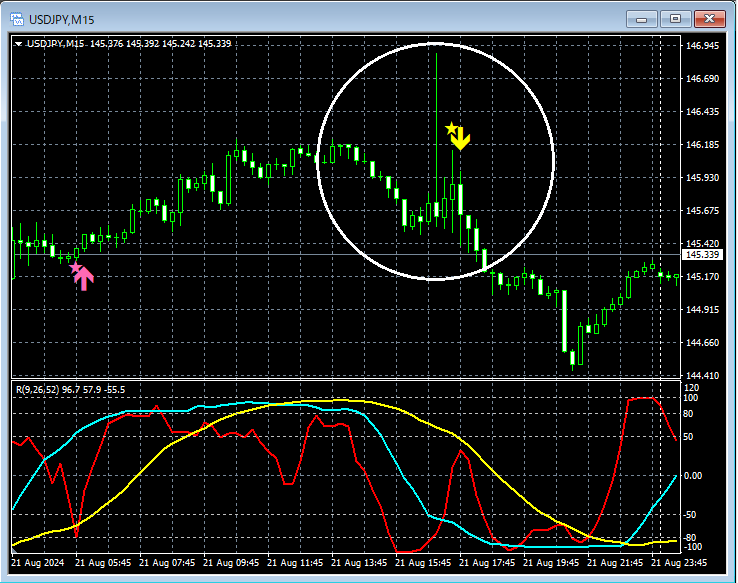
Looking at the 15-minute chart above, in the area enclosed by a white circle, a signal of a decline is indicated.Pin Bar (long upper shadow)appears. After that,mBDSR (Filter: RCI26 and RCI52) short selling signallights up and the price clearly declines.
From this example,a trading method focused on the Pin Bar (long upper shadow)andthe signals of mBDSRshow strong compatibility.
Indicator that shines in combination with RCI: 【BODSOR・mBDSR】
Methods and Case Studies (PDF) ★GogoJungle AWARD2020 Winner★
https://www.gogojungle.co.jp/tools/indicators/11836
The PDFs include 301 files (over 1,000 pages, over 350,000 characters in total).
Many of them are about using three RCI lines to logically link higher and lower timeframes, sequentially examining multiple lower-timeframe conditions, and ultimately waiting for buy-on-dips or sell-on-rallies on the lower timeframes (i.e., signals from mBDSR).In other words, they are compiled as examples that have been distilled into a form that waits for lower-timeframe timing through logical linking of RCI lines.
Additionally,many focus on identifying points where multiple entry reasons coincide.
In the explanations,over 1,000 chartshave been used.

Methods and Case Studies (PDF) ★GogoJungle AWARD2020 Winner★
https://www.gogojungle.co.jp/tools/indicators/11836
The above products include 301 PDFs. For a list of the PDF titles and other details, please see the article below.
About the 301 attached PDF files for 【BODSOR・mBDSR】
https://www.gogojungle.co.jp/finance/navi/articles/34271
USD/JPY 15-minute chart
Looking at the 15-minute chart above, in the area enclosed by a white circle, a signal of a decline is indicated.Pin Bar (long upper shadow)appears. After that,mBDSR (Filter: RCI26 and RCI52) short selling signallights up and the price clearly declines.
From this example,a trading method focused on the Pin Bar (long upper shadow)andthe signals of mBDSRshow strong compatibility.
Indicator that shines in combination with RCI: 【BODSOR・mBDSR】
Methods and Case Studies (PDF) ★GogoJungle AWARD2020 Winner★
https://www.gogojungle.co.jp/tools/indicators/11836
The PDFs include 301 files (over 1,000 pages, over 350,000 characters in total).
Many of them are about using three RCI lines to logically link higher and lower timeframes, sequentially examining multiple lower-timeframe conditions, and ultimately waiting for buy-on-dips or sell-on-rallies on the lower timeframes (i.e., signals from mBDSR).In other words, they are compiled as examples that have been distilled into a form that waits for lower-timeframe timing through logical linking of RCI lines.
Additionally,many focus on identifying points where multiple entry reasons coincide.
In the explanations,over 1,000 chartshave been used.
× ![]()


