

[Good Risk-Reward Trade] A dip-buy signal formed at the right trough of the double bottom on the higher timeframe, with the double bottom and mBDSR (RCI 2-line filter).
0
Indicator that shines in combination with RCI: BODSOR・mBDSR
Method and Case Study (PDF) ★GogoJungle AWARD 2020 winner★
https://www.gogojungle.co.jp/tools/indicators/11836
GBP/JPY 30-minute chart
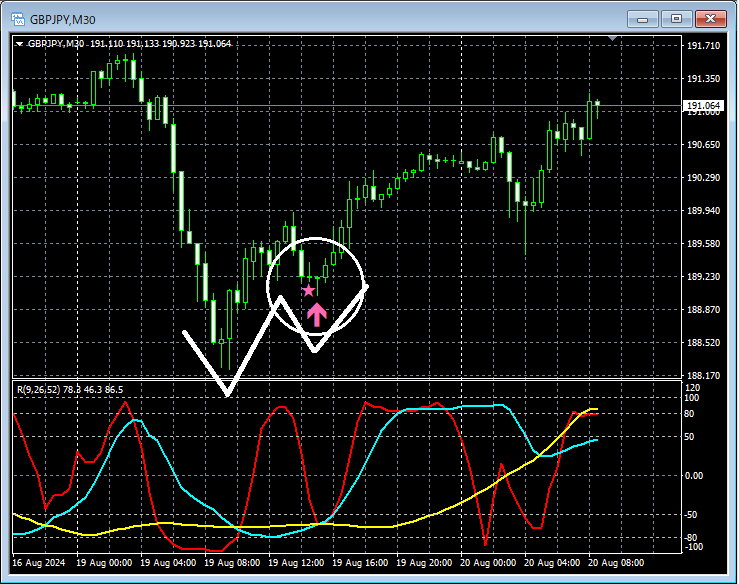
On the 30-minute chart above,the right-side valley of the Double Bottomis lighting up withthe buy signal on the mBDSR (two RCI lines) filter. Here, after the buy signal lights up, we will also look for signs of a rebound on the lower timeframe.
GBP/JPY 1-minute chart
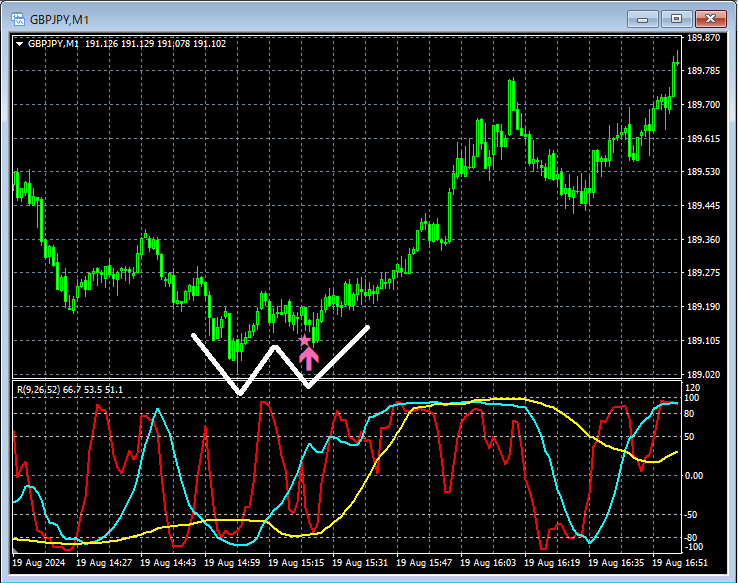
After the 30-minute chart lights up thebuy signal on the mBDSR filter (two RCI lines), the 1-minute chart above alsoforms a Double Bottom. The buy signal on the mBDSR (two RCI lines)The buy signal on the mBDSR (two RCI lines)captures the timing of the rise at the right-side valley of theDouble Bottomquite well.
From this example,a trading method focused on Double Bottomsand thesignals of mBDSRshow strong compatibility.
Also, in this example on the 1-minute chart, by placing the stop-loss at the left valley of the Double Bottom (the recent low),the trade can have a good risk-reward profile.
Note: In the charts introduced in this article, for convenience of explanation, circles, lines, rectangles, etc. may be added, so please be aware of this.
Indicator that shines in combination with RCI: BODSOR・mBDSR
Method and Case Study (PDF) ★GogoJungle AWARD 2020 winner★
https://www.gogojungle.co.jp/tools/indicators/11836
The PDF file includes 358 items (over 1,400 pages, over 470,000 characters).
Many of these are designed to logically link the higher and lower timeframes using three RCI lines, gradually examining the status of multiple lower timeframes, and ultimately waiting for pullbacks on the lower timeframes (i.e., mBDSR signals).Additionally,
many focus on identifying points where multiple entry reasons align..
Furthermore,there are also methods that explore upward and downward targets using three RCI lines..
In the explanations within the PDF files,more than 1,350 chartsare used.

Method and Case Study (PDF) ★GogoJungle AWARD 2020 winner★
https://www.gogojungle.co.jp/tools/indicators/11836
GBP/JPY 30-minute chart
On the 30-minute chart above,the right-side valley of the Double Bottomis lighting up withthe buy signal on the mBDSR (two RCI lines) filter. Here, after the buy signal lights up, we will also look for signs of a rebound on the lower timeframe.
GBP/JPY 1-minute chart
After the 30-minute chart lights up thebuy signal on the mBDSR filter (two RCI lines), the 1-minute chart above alsoforms a Double Bottom. The buy signal on the mBDSR (two RCI lines)The buy signal on the mBDSR (two RCI lines)captures the timing of the rise at the right-side valley of theDouble Bottomquite well.
From this example,a trading method focused on Double Bottomsand thesignals of mBDSRshow strong compatibility.
Also, in this example on the 1-minute chart, by placing the stop-loss at the left valley of the Double Bottom (the recent low),the trade can have a good risk-reward profile.
Note: In the charts introduced in this article, for convenience of explanation, circles, lines, rectangles, etc. may be added, so please be aware of this.
Indicator that shines in combination with RCI: BODSOR・mBDSR
Method and Case Study (PDF) ★GogoJungle AWARD 2020 winner★
https://www.gogojungle.co.jp/tools/indicators/11836
The PDF file includes 358 items (over 1,400 pages, over 470,000 characters).
Many of these are designed to logically link the higher and lower timeframes using three RCI lines, gradually examining the status of multiple lower timeframes, and ultimately waiting for pullbacks on the lower timeframes (i.e., mBDSR signals).Additionally,
many focus on identifying points where multiple entry reasons align..
Furthermore,there are also methods that explore upward and downward targets using three RCI lines..
In the explanations within the PDF files,more than 1,350 chartsare used.
× ![]()


