

[Good Risk-Reward Trade] Overlying Downtrend Line, Retrace Highs, and the mBDSR (RCI two-peg filter) Rebound Sell Signal
Indicator that shows power when combined with RCI: BODSOR and mBDSR
Methods and Case Studies (PDF) ★GogoJungle AWARD2020 Winner★
https://www.gogojungle.co.jp/tools/indicators/11836
EURJPY 1-hour chart
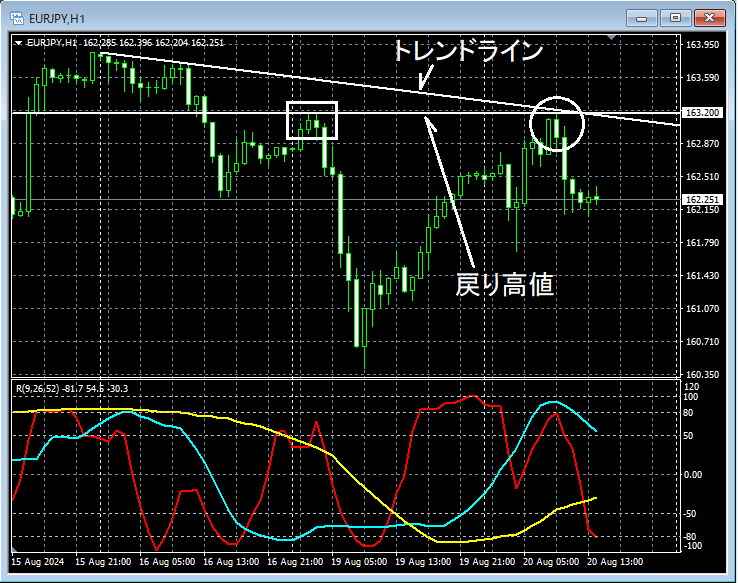
If you look at the area circled in white above on the 1-hour chart,a downward trendlineanda retest highconverge, it may be a scenario where selling on pullback on lower timeframes is not unusual. We will look for signs of reversal on the lower timeframe.
EURJPY 5-minute chart
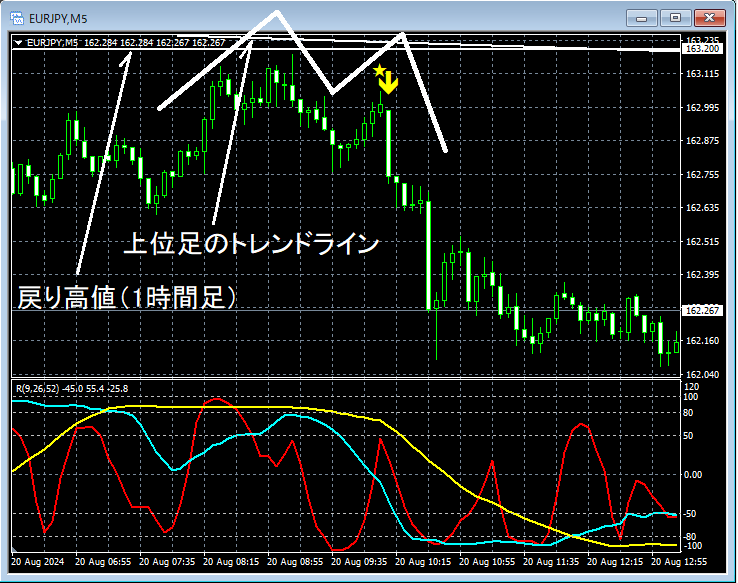
On the above 5-minute chart,the downward trendline and the retest high on the higher timeframecoincide to forma double topand move down. Here,the mBDSR (filters: RCI26 and RCI52) pullback sell signalcaptures the timing of the downward move starting at the right peak of the double topwell.
The rise up to where the lower timeframe’s downward trendline and retest high overlapandthe mBDSR (two RCI filters) pullback sell signal indicatorare overlapping as multiple entry reasons.
From this example,a trading method focused on downward trendlines, retest highs, and double topsandthe signals of mBDSRshow strong compatibility.
Also in this example, placing the stop-loss at theleft-side peak of the double top (recent high)allows fora favorable risk-reward trade.
※Please note that in the charts introduced in this article, for convenience of explanation, circles, lines, and squares may have been added.
Indicator that shines when combined with RCI: BODSOR and mBDSR
Methods and Case Studies (PDF) ★GogoJungle AWARD2020 Winner★
https://www.gogojungle.co.jp/tools/indicators/11836
The PDF file contains 358 files (over 1,400 pages, over 470,000 characters).
Many of thesesummarize examples where multiple lower-timeframe conditions are logically linked to higher timeframes using a three-RCI-line approach, ultimately waiting for the pullback buying or selling timing on the lower timeframes (the mBDSR signals)..
Additionally,there are many that emphasize capturing points where multiple entry reasons coincide..
Furthermore,there are also methods exploring upside and downside targets using three RCI lines..
In the explanations within the PDF file,more than 1,350 chartsare used.

Methods and Case Studies (PDF) ★GogoJungle AWARD2020 Winner★
https://www.gogojungle.co.jp/tools/indicators/11836
EURJPY 1-hour chart
If you look at the area circled in white above on the 1-hour chart,a downward trendlineanda retest highconverge, it may be a scenario where selling on pullback on lower timeframes is not unusual. We will look for signs of reversal on the lower timeframe.
EURJPY 5-minute chart
On the above 5-minute chart,the downward trendline and the retest high on the higher timeframecoincide to forma double topand move down. Here,the mBDSR (filters: RCI26 and RCI52) pullback sell signalcaptures the timing of the downward move starting at the right peak of the double topwell.
The rise up to where the lower timeframe’s downward trendline and retest high overlapandthe mBDSR (two RCI filters) pullback sell signal indicatorare overlapping as multiple entry reasons.
From this example,a trading method focused on downward trendlines, retest highs, and double topsandthe signals of mBDSRshow strong compatibility.
Also in this example, placing the stop-loss at theleft-side peak of the double top (recent high)allows fora favorable risk-reward trade.
※Please note that in the charts introduced in this article, for convenience of explanation, circles, lines, and squares may have been added.
Indicator that shines when combined with RCI: BODSOR and mBDSR
Methods and Case Studies (PDF) ★GogoJungle AWARD2020 Winner★
https://www.gogojungle.co.jp/tools/indicators/11836
The PDF file contains 358 files (over 1,400 pages, over 470,000 characters).
Many of thesesummarize examples where multiple lower-timeframe conditions are logically linked to higher timeframes using a three-RCI-line approach, ultimately waiting for the pullback buying or selling timing on the lower timeframes (the mBDSR signals)..
Additionally,there are many that emphasize capturing points where multiple entry reasons coincide..
Furthermore,there are also methods exploring upside and downside targets using three RCI lines..
In the explanations within the PDF file,more than 1,350 chartsare used.
× ![]()


