

From the USD/JPY chart of yesterday (August 20, 2024) - Elliott Wave and mBDSR (RCI two-filter) return-selling signal -
Indicator that captures the bottom and reversal in combination with RCI: 【mBDSR】
Method and Case Study (PDF) ★GogoJungle AWARD2020 Winner★
https://www.gogojungle.co.jp/tools/indicators/11836
The above product includes 301 PDFs (methods, case studies, etc.). For the list of the PDF titles, please refer to the article below.
About the 301 PDF files included with 【BODSOR・mBDSR】
https://www.gogojungle.co.jp/finance/navi/articles/34271
USD/JPY 5-min chart
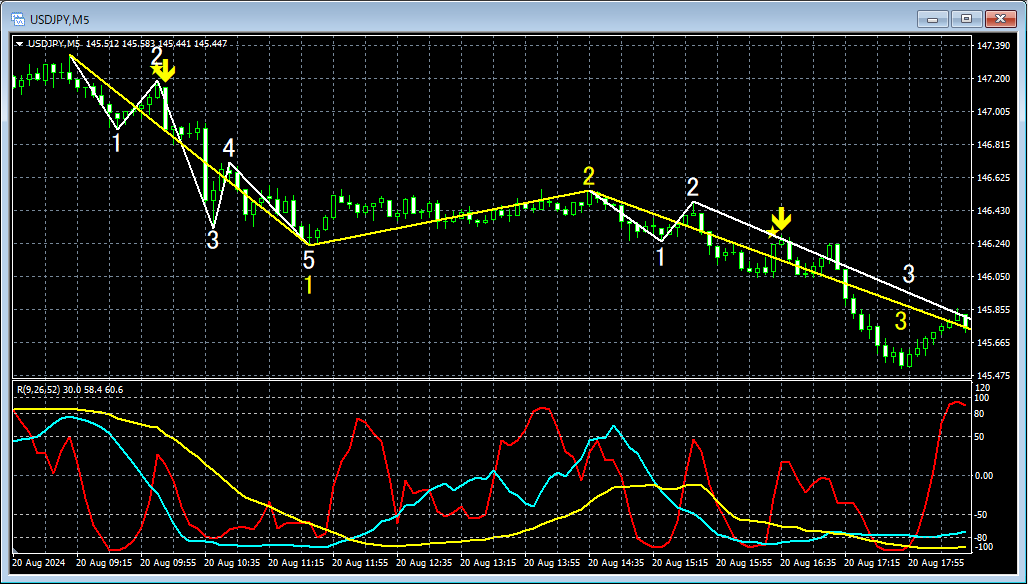
In the 5-minute chart above, the 5-minute chartElliott Wave (Yellow) and the 1-minute chartElliott Wave (White) are displayed. On the 5-minute chart,Wave 1 of the Downtrend mid-way (at the beginning of the 1-minuteWave 3 of the Downtrend phase), and on the 5-minute chart,Wave 3 of the Downtrend mid-way (at the beginning of the 1-minuteWave 3 of the Downtrend mid-way) themBDSR (RCI with two lines) sell-reverse signal lights up and the price continues to drop smoothly.
From this example,Elliott Wave andmBDSR signals show a high level of compatibility.
Indicator that excels in combination with RCI: 【BODSOR・mBDSR】
Method and Case Study (PDF) ★GogoJungle AWARD2020 Winner★
https://www.gogojungle.co.jp/tools/indicators/11836
The package includes 301 PDF files.
Many of them document a pattern where, by logically linking multiple timeframes using three RCI lines, several lower-timeframe situations are considered sequentially, ultimately waiting for a bottom-buy or pullback-sell timing (i.e., the mBDSR signal) on the lower timeframes.In other words, they describe a process that culminates in a structured approach for lower-timeframe entries.
Furthermore,many of them focus on pinpointing points where multiple entry reasons overlap.There are numerous examples focusing on this.
The explanations usemore than 1,000 charts.

Method and Case Study (PDF) ★GogoJungle AWARD2020 Winner★
https://www.gogojungle.co.jp/tools/indicators/11836
The above product includes 301 PDFs (methods, case studies, etc.). For the list of the PDF titles, please refer to the article below.
About the 301 PDF files included with 【BODSOR・mBDSR】
https://www.gogojungle.co.jp/finance/navi/articles/34271
USD/JPY 5-min chart
In the 5-minute chart above, the 5-minute chartElliott Wave (Yellow) and the 1-minute chartElliott Wave (White) are displayed. On the 5-minute chart,Wave 1 of the Downtrend mid-way (at the beginning of the 1-minuteWave 3 of the Downtrend phase), and on the 5-minute chart,Wave 3 of the Downtrend mid-way (at the beginning of the 1-minuteWave 3 of the Downtrend mid-way) themBDSR (RCI with two lines) sell-reverse signal lights up and the price continues to drop smoothly.
From this example,Elliott Wave andmBDSR signals show a high level of compatibility.
Indicator that excels in combination with RCI: 【BODSOR・mBDSR】
Method and Case Study (PDF) ★GogoJungle AWARD2020 Winner★
https://www.gogojungle.co.jp/tools/indicators/11836
The package includes 301 PDF files.
Many of them document a pattern where, by logically linking multiple timeframes using three RCI lines, several lower-timeframe situations are considered sequentially, ultimately waiting for a bottom-buy or pullback-sell timing (i.e., the mBDSR signal) on the lower timeframes.In other words, they describe a process that culminates in a structured approach for lower-timeframe entries.
Furthermore,many of them focus on pinpointing points where multiple entry reasons overlap.There are numerous examples focusing on this.
The explanations usemore than 1,000 charts.
× ![]()


