

Shiragata Five Methods “Venus at Dawn” and mBDSR’s Buy-the-Dip Signal and an Investigation of the Lower Timeframe Conditions
Indicator that demonstrates power in combination with RCI【BODSOR・mBDSR】
Methods, Case Studies (PDF) ★GogoJungle AWARD2020 winner★
https://www.gogojungle.co.jp/tools/indicators/11836
USDJPY 30-minute chart
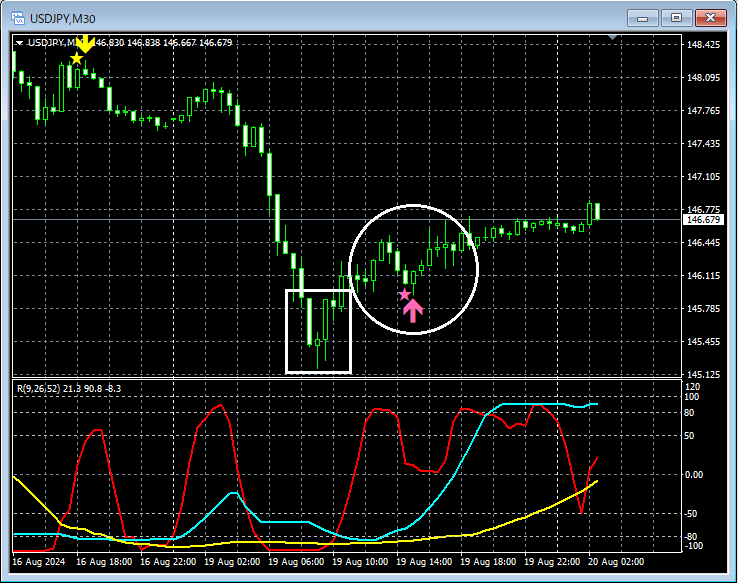
If you look at the area outlined in white on the 30-minute chart aboveSakata’s Five Methods “Morning Star”appears. This candlestick pattern suggests a bullish reversal. After that,mBDSR (RCI two-line filter) buy signallights up, and the price rises. Here, we will examine in detail, at the lower time frame, the situation around the point where that buy signal lights up.
USDJPY 5-minute chart

On the higher timeframe of the 30-minute chart,Sakata’s Five Methods “Morning Star”appears, and on the upper 5-minute chartbreaks above the previous highafter which it declines toward thepullback lowarea, at which point the 30-minute chart buy signal lights up.
Occurrence of Sakata’s Five Methods “Morning Star”andbreak above the pullback highandpullback toward the pullback lowandmBDSR buy signal lights up— multiple entry bases align here.
From this example,the compatibility between trading methods that focus on Sakata’s Five Methods “Morning Star” and Dow Theory (pullback highs and pullback lows)andthe signals of mBDSRbecomes apparent.
※ Please note that in the charts introduced in this article, for convenience of explanation, circles, lines, and squares may be drawn.
Indicator that demonstrates power in combination with RCI【BODSOR・mBDSR】
Methods, Case Studies (PDF) ★GogoJungle AWARD2020 winner★
https://www.gogojungle.co.jp/tools/indicators/11836
The PDF file includes 358 items (over 1,400 pages, over 470,000 characters).
Many of these are examples where, by logically linking higher and lower timeframes using three RCI lines, the status of multiple lower timeframes is examined successively, ultimately waiting for buy signals at pullbacks or sell signals at rallies on the lower timeframe (i.e., the signals of mBDSR).
Additionally,many emphasize capturing points where multiple entry bases coincide..
Note thatthis also includes methods that explore upward and downward targets using three RCI lines..
In the description within the PDF fileover 1,350 chartsare used.

Methods, Case Studies (PDF) ★GogoJungle AWARD2020 winner★
https://www.gogojungle.co.jp/tools/indicators/11836
USDJPY 30-minute chart
If you look at the area outlined in white on the 30-minute chart aboveSakata’s Five Methods “Morning Star”appears. This candlestick pattern suggests a bullish reversal. After that,mBDSR (RCI two-line filter) buy signallights up, and the price rises. Here, we will examine in detail, at the lower time frame, the situation around the point where that buy signal lights up.
USDJPY 5-minute chart
On the higher timeframe of the 30-minute chart,Sakata’s Five Methods “Morning Star”appears, and on the upper 5-minute chartbreaks above the previous highafter which it declines toward thepullback lowarea, at which point the 30-minute chart buy signal lights up.
Occurrence of Sakata’s Five Methods “Morning Star”andbreak above the pullback highandpullback toward the pullback lowandmBDSR buy signal lights up— multiple entry bases align here.
From this example,the compatibility between trading methods that focus on Sakata’s Five Methods “Morning Star” and Dow Theory (pullback highs and pullback lows)andthe signals of mBDSRbecomes apparent.
※ Please note that in the charts introduced in this article, for convenience of explanation, circles, lines, and squares may be drawn.
Indicator that demonstrates power in combination with RCI【BODSOR・mBDSR】
Methods, Case Studies (PDF) ★GogoJungle AWARD2020 winner★
https://www.gogojungle.co.jp/tools/indicators/11836
The PDF file includes 358 items (over 1,400 pages, over 470,000 characters).
Many of these are examples where, by logically linking higher and lower timeframes using three RCI lines, the status of multiple lower timeframes is examined successively, ultimately waiting for buy signals at pullbacks or sell signals at rallies on the lower timeframe (i.e., the signals of mBDSR).
Additionally,many emphasize capturing points where multiple entry bases coincide..
Note thatthis also includes methods that explore upward and downward targets using three RCI lines..
In the description within the PDF fileover 1,350 chartsare used.
× ![]()


