

[Today's USDJPY Strategy] Signals from lines that have previously acted as resistance or support and mBDSR (RCI two-filter) from the chart of today (August 19, 2024)
Indicator "Capture Tops and Reversals" in combination with RCI【mBDSR】
Methods, Case Studies (PDF) ★GogoJungle AWARD 2020 winner★
https://www.gogojungle.co.jp/tools/indicators/11836
The above products include 301 PDF files. For a list of those PDFs’ titles, please see the article below.
About the 301 PDF files included with 【BODSOR・mBDSR】
https://www.gogojungle.co.jp/finance/navi/articles/34271
USD/JPY 1-hour chart
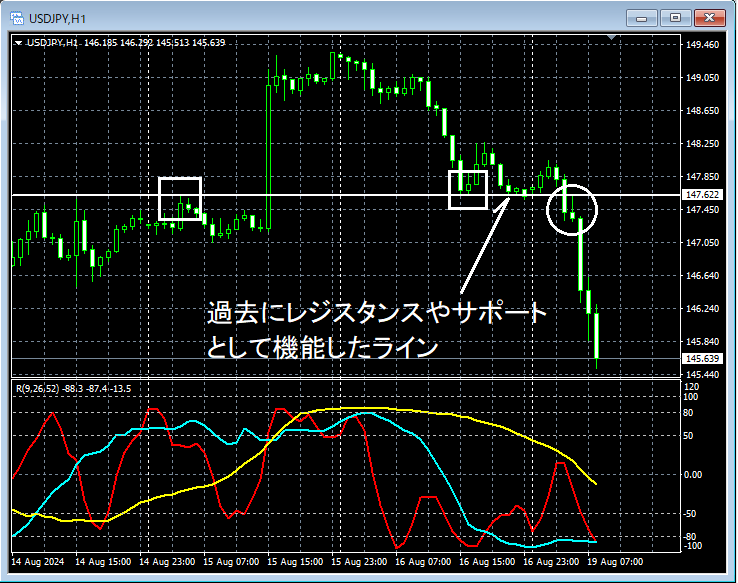
If you look at the area circled in white on the 1-hour chart above,the line that previously functioned as resistance or supporthas been breached to the downside. We'll examine it in more detail on a lower time frame.
USD/JPY 5-minute chart
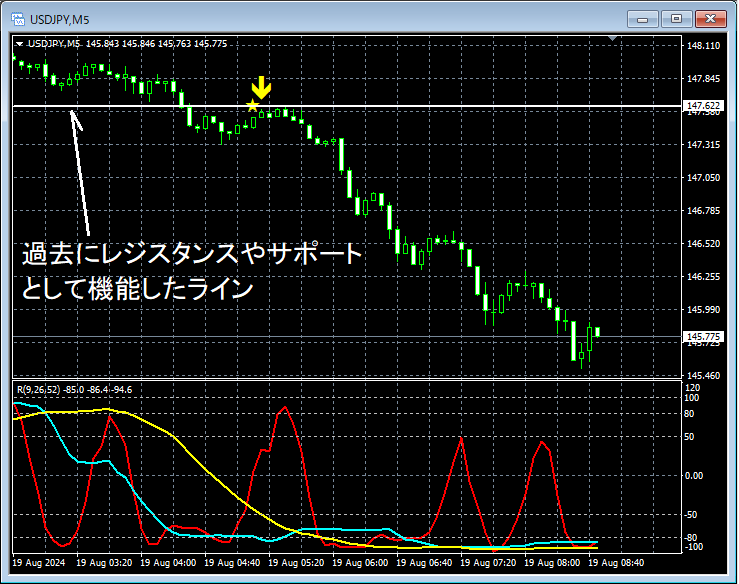
On the 5-minute chart above,the line that previously acted as resistance or supportis broken below, and around that area the price rose toward the linemBDSR (filters: RCI26 and RCI52) sell signallights up. After that, the price falls significantly.
From this example,it is evident that a trading method focused on past resistance and supportandthe signals of mBDSRhave a high degree of compatibility.
Indicator "BODSOR・mBDSR" that performs strongly in combination with RCI
Methods, Case Studies (PDF) ★GogoJungle AWARD 2020 winner★
https://www.gogojungle.co.jp/tools/indicators/11836
The PDF files amount to 301 files (over 1,000 pages, over 350,000 characters in total).
Many of these areexamples that logically link higher and lower timeframes by using the RCI三-line (RCI three lines), sequentially considering the conditions of multiple lower timeframes, and ultimately waiting for a timing to go long on pullbacks or to go short on rallies (i.e., mBDSR signals).
Additionally,there are many that focus on capturing points where multiple entry signals overlap.
In the explanations,more than 1,000 chartsare used.

Methods, Case Studies (PDF) ★GogoJungle AWARD 2020 winner★
https://www.gogojungle.co.jp/tools/indicators/11836
The above products include 301 PDF files. For a list of those PDFs’ titles, please see the article below.
About the 301 PDF files included with 【BODSOR・mBDSR】
https://www.gogojungle.co.jp/finance/navi/articles/34271
USD/JPY 1-hour chart
If you look at the area circled in white on the 1-hour chart above,the line that previously functioned as resistance or supporthas been breached to the downside. We'll examine it in more detail on a lower time frame.
USD/JPY 5-minute chart
On the 5-minute chart above,the line that previously acted as resistance or supportis broken below, and around that area the price rose toward the linemBDSR (filters: RCI26 and RCI52) sell signallights up. After that, the price falls significantly.
From this example,it is evident that a trading method focused on past resistance and supportandthe signals of mBDSRhave a high degree of compatibility.
Indicator "BODSOR・mBDSR" that performs strongly in combination with RCI
Methods, Case Studies (PDF) ★GogoJungle AWARD 2020 winner★
https://www.gogojungle.co.jp/tools/indicators/11836
The PDF files amount to 301 files (over 1,000 pages, over 350,000 characters in total).
Many of these areexamples that logically link higher and lower timeframes by using the RCI三-line (RCI three lines), sequentially considering the conditions of multiple lower timeframes, and ultimately waiting for a timing to go long on pullbacks or to go short on rallies (i.e., mBDSR signals).
Additionally,there are many that focus on capturing points where multiple entry signals overlap.
In the explanations,more than 1,000 chartsare used.
× ![]()


