

Breakout above previous high and double bottom and mBDSR (RCI 2-line filter) pullback buy signal
0
Indicator that shines when combined with RCI: 【BODSOR・mBDSR】
Methods, case studies (PDF) ★GogoJungle AWARD2020 Winner★
https://www.gogojungle.co.jp/tools/indicators/11836
AUDUSD 5-minute chart
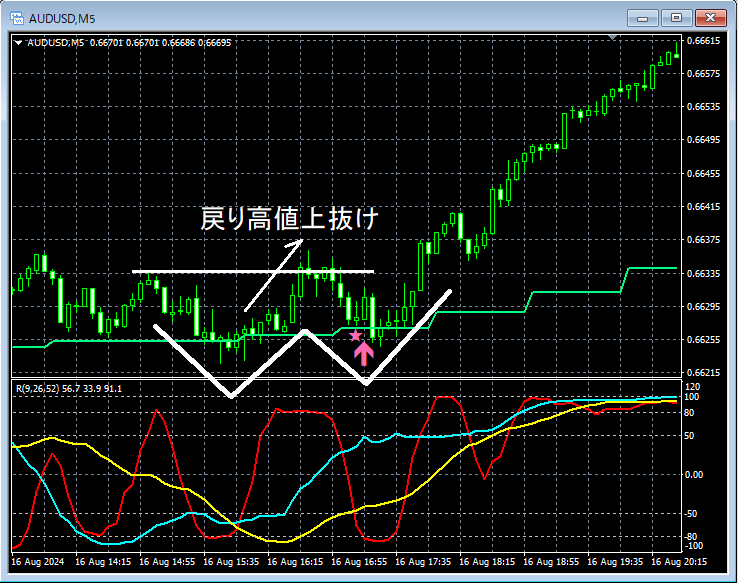
In the 5-minute chart above,retracement highis broken to the upside, and on the subsequent pullbackmBDSR (2-filter RCI lines)buy sign lights up, and price subsequently rises smoothly. Also, in this case,double bottomsigns may be observed on the right-hand valley of the pattern.
From this example,the trade method focusing on Dow Theory and double bottomsandthe compatibility with mBDSR signalsappear clearly evident.
Additionally, in this example, placing the stop loss just below the most recent low (the left valley of the double bottom)enables a favorable risk-reward tradeprofile.
※For readability, the charts referenced in this article may include circles, lines, and rectangles for illustration purposes, which please understand.
Indicator that shines when combined with RCI: 【BODSOR・mBDSR】
Methods, case studies (PDF) ★GogoJungle AWARD2020 Winner★
https://www.gogojungle.co.jp/tools/indicators/11836
The PDF file includes 341 items (over 1,200 pages, over 430,000 characters).
Most of these are compiled as examples that logically link higher and lower timeframes using three RCI lines to examine multiple lower-timeframe conditions sequentially, ultimately waiting for pullbacks or retracements (i.e., mBDSR signals) on the lower timeframes.
In addition,many emphasize identifying points where multiple entry justifications coincide.Also frequent.
Moreover,there are techniques that explore upward and downward targets using three RCI lines.Also included.
In the PDF explanations,are used.

Methods, case studies (PDF) ★GogoJungle AWARD2020 Winner★
https://www.gogojungle.co.jp/tools/indicators/11836
AUDUSD 5-minute chart
In the 5-minute chart above,retracement highis broken to the upside, and on the subsequent pullbackmBDSR (2-filter RCI lines)buy sign lights up, and price subsequently rises smoothly. Also, in this case,double bottomsigns may be observed on the right-hand valley of the pattern.
From this example,the trade method focusing on Dow Theory and double bottomsandthe compatibility with mBDSR signalsappear clearly evident.
Additionally, in this example, placing the stop loss just below the most recent low (the left valley of the double bottom)enables a favorable risk-reward tradeprofile.
※For readability, the charts referenced in this article may include circles, lines, and rectangles for illustration purposes, which please understand.
Indicator that shines when combined with RCI: 【BODSOR・mBDSR】
Methods, case studies (PDF) ★GogoJungle AWARD2020 Winner★
https://www.gogojungle.co.jp/tools/indicators/11836
The PDF file includes 341 items (over 1,200 pages, over 430,000 characters).
Most of these are compiled as examples that logically link higher and lower timeframes using three RCI lines to examine multiple lower-timeframe conditions sequentially, ultimately waiting for pullbacks or retracements (i.e., mBDSR signals) on the lower timeframes.
In addition,many emphasize identifying points where multiple entry justifications coincide.Also frequent.
Moreover,there are techniques that explore upward and downward targets using three RCI lines.Also included.
In the PDF explanations,are used.
× ![]()


