

Break of support and mBDSR (RCI2 double filter) selling signal
Indicator that shines in combination with RCI【BODSOR・mBDSR】
and Methods / Case Studies (PDF) ★GogoJungle AWARD2020 winner★
https://www.gogojungle.co.jp/tools/indicators/11836
Swiss Franc to Japanese Yen CHFJPY 5-minute chart
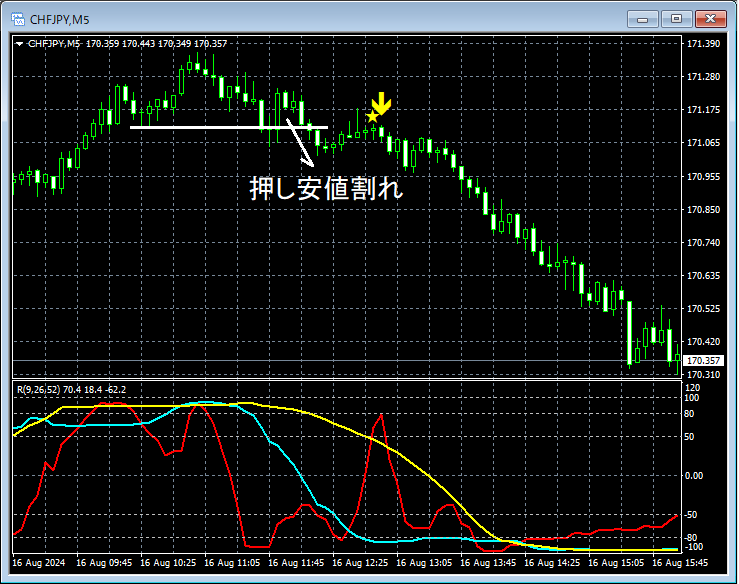
On the 5-minute chart above,a break below the “pullback low”triggers a mBDSR (RCI two-filter) sell signal on the rebound, after which the price steadily declines.
From this example,the compatibility between Dow Theory–focused trading methodsandthe signals of mBDSRis evident.
※Please note that in the charts presented in this article, for convenience of explanation, circles, straight lines, and squares may be drawn.
Indicator that shines in combination with RCI【BODSOR・mBDSR】
and Methods / Case Studies (PDF) ★GogoJungle AWARD2020 winner★
https://www.gogojungle.co.jp/tools/indicators/11836
The PDF file includes 341 items (over 1,200 pages, over 430,000 characters in total).
Many of these are summaries of examples that have been logically linked by using the three RCI lines to connect higher and lower timeframes, ultimately waiting for pullback buying or selling timings (i.e., mBDSR signals) on the lower timeframe.
Additionally,there are many that focus on identifying points where multiple entry reasons overlap.More than a few also include methods to explore upward and downward targets using three RCI lines.
In the description within the PDF files,
over 1,200 chartsare used.

and Methods / Case Studies (PDF) ★GogoJungle AWARD2020 winner★
https://www.gogojungle.co.jp/tools/indicators/11836
Swiss Franc to Japanese Yen CHFJPY 5-minute chart
On the 5-minute chart above,a break below the “pullback low”triggers a mBDSR (RCI two-filter) sell signal on the rebound, after which the price steadily declines.
From this example,the compatibility between Dow Theory–focused trading methodsandthe signals of mBDSRis evident.
※Please note that in the charts presented in this article, for convenience of explanation, circles, straight lines, and squares may be drawn.
Indicator that shines in combination with RCI【BODSOR・mBDSR】
and Methods / Case Studies (PDF) ★GogoJungle AWARD2020 winner★
https://www.gogojungle.co.jp/tools/indicators/11836
The PDF file includes 341 items (over 1,200 pages, over 430,000 characters in total).
Many of these are summaries of examples that have been logically linked by using the three RCI lines to connect higher and lower timeframes, ultimately waiting for pullback buying or selling timings (i.e., mBDSR signals) on the lower timeframe.
Additionally,there are many that focus on identifying points where multiple entry reasons overlap.More than a few also include methods to explore upward and downward targets using three RCI lines.
In the description within the PDF files,
over 1,200 chartsare used.
× ![]()


