

[JP225 Strategy] Double Top Neckline and mBDSR (RCI2-band filter) Rebound Sell Signal from chart of last Friday (August 16, 2024)
Indicator that captures “tops and bottoms and reversals” in combination with RCI【mBDSR】
and methods / case studies (PDF) ★GogoJungle AWARD2020 winner★
https://www.gogojungle.co.jp/tools/indicators/11836
The above products include 301 PDFs (methods, case studies, etc.). For a list of the titles of those PDFs, please see the article below.
About the 301 PDF files included with 【BODSOR・mBDSR】
https://www.gogojungle.co.jp/finance/navi/articles/34271
JP225 5-minute chart
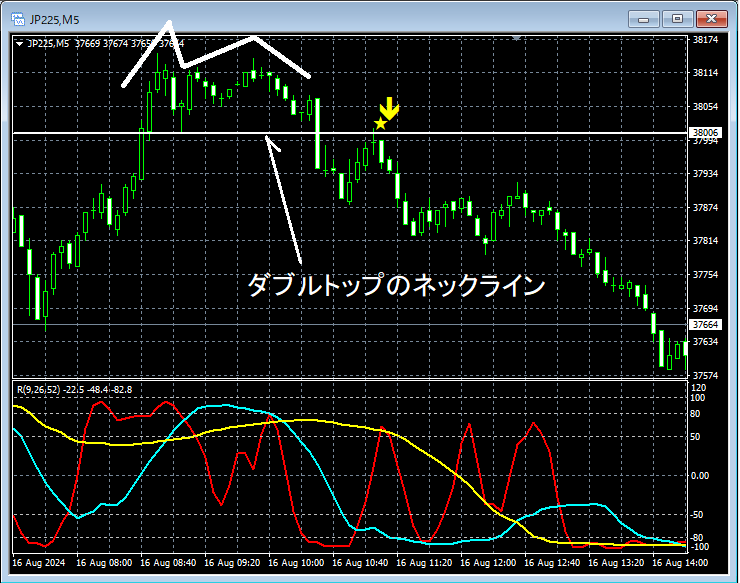
In the 5-minute chart above,the neckline of the double toprises near themBDSR (RCI 2-lines filter) reversal sell signallights up, and then it declines steadily.
From this example,a trading method focusing on double topsand thesignals of mBDSRshow high compatibility.
Indicator that demonstrates its power in combination with RCI【BODSOR・mBDSR】
and methods / case studies (PDF) ★GogoJungle AWARD2020 winner★
https://www.gogojungle.co.jp/tools/indicators/11836
PDF files include 301 items.
Many of them explain the process of logically linking higher and lower timeframes by using three RCI lines, examining the conditions of multiple lower timeframes step by step, and ultimately waiting for timing to buy on dips or sell on rebounds on the lower timeframe (i.e., the mBDSR signals).It is summarized in that manner.
In addition,there are many that focus on capturing points where multiple entry bases overlap.There are many.
The description usesover 1,000 charts in total..

and methods / case studies (PDF) ★GogoJungle AWARD2020 winner★
https://www.gogojungle.co.jp/tools/indicators/11836
The above products include 301 PDFs (methods, case studies, etc.). For a list of the titles of those PDFs, please see the article below.
About the 301 PDF files included with 【BODSOR・mBDSR】
https://www.gogojungle.co.jp/finance/navi/articles/34271
JP225 5-minute chart
In the 5-minute chart above,the neckline of the double toprises near themBDSR (RCI 2-lines filter) reversal sell signallights up, and then it declines steadily.
From this example,a trading method focusing on double topsand thesignals of mBDSRshow high compatibility.
Indicator that demonstrates its power in combination with RCI【BODSOR・mBDSR】
and methods / case studies (PDF) ★GogoJungle AWARD2020 winner★
https://www.gogojungle.co.jp/tools/indicators/11836
PDF files include 301 items.
Many of them explain the process of logically linking higher and lower timeframes by using three RCI lines, examining the conditions of multiple lower timeframes step by step, and ultimately waiting for timing to buy on dips or sell on rebounds on the lower timeframe (i.e., the mBDSR signals).It is summarized in that manner.
In addition,there are many that focus on capturing points where multiple entry bases overlap.There are many.
The description usesover 1,000 charts in total..
× ![]()


